vrealize operations: capacity planning
Project overview
The PRODUCT
vRealize Operations Manager is a tool used by virtual infrastructure teams to manage, monitor, troubleshoot, plan, and optimize their virtual cloud environments. The product helps ensure business applications receive the resources they need to stay up and running.
The GOAL
As part of release planning, my team and I worked with product managers to understand and prioritize customer asks. We evaluated what customers wanted most in the next release and (as I’ll explain below) discovered capacity planning was a top ask. Our goal was to ensure all capacity planning needs were met in a simple, usable way inside vRealize Operations Manager.
My Role
I worked with a team of two other product designers and one user researcher. My role involved creating designs for multiple capacity planning workflows, conducting user research, and collaborating with PMs and engineers on direction and technical details, respectively.
THE PROCESS
For the project, we used the following process:
1) Prioritization
2) User Interviews
3) Pain Point Synthesis
4) Design Sprints
5) Iteration and Prototypes
6) Validation and Refinement
Prioritization
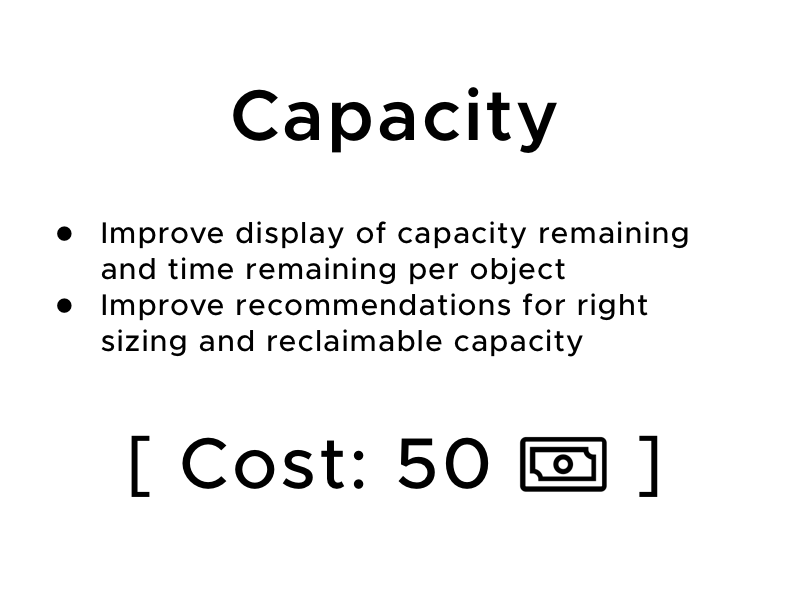
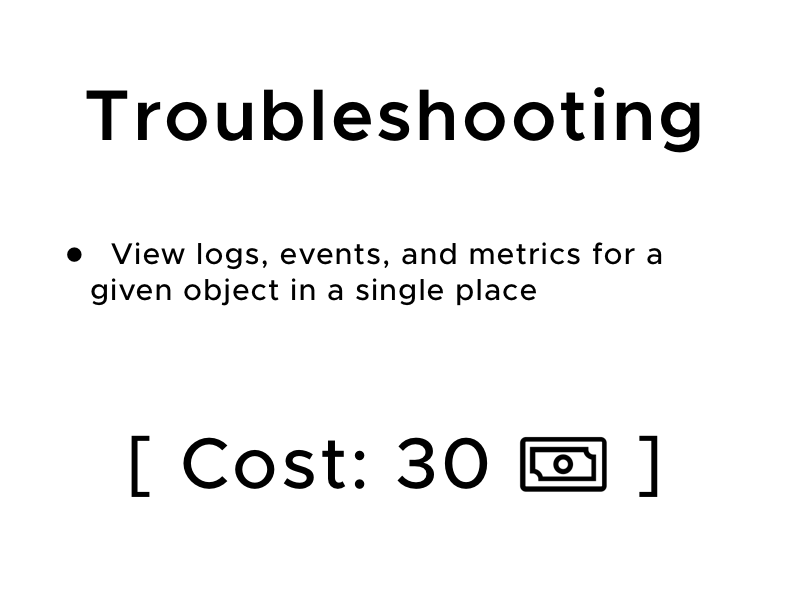
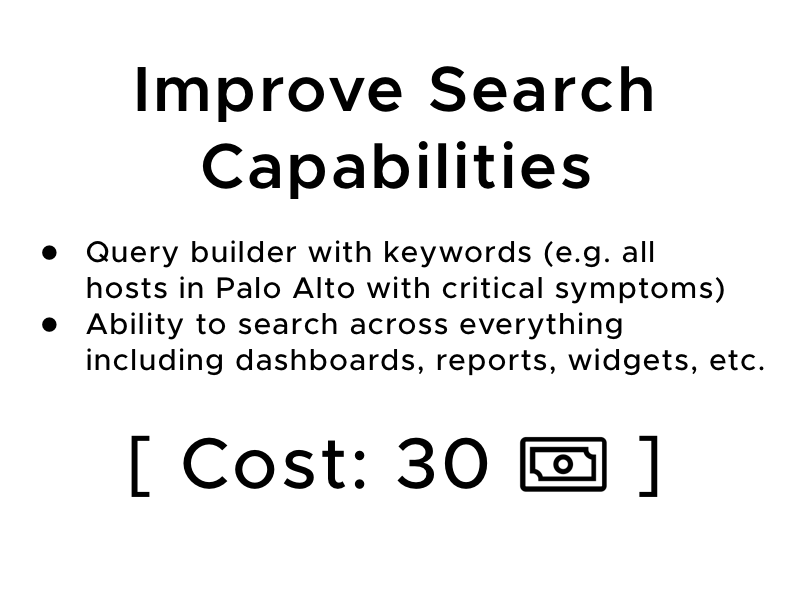
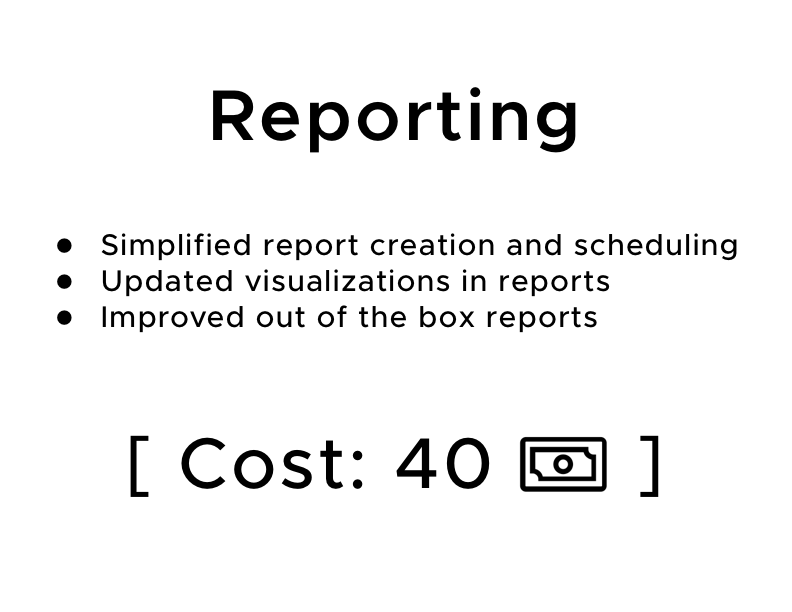
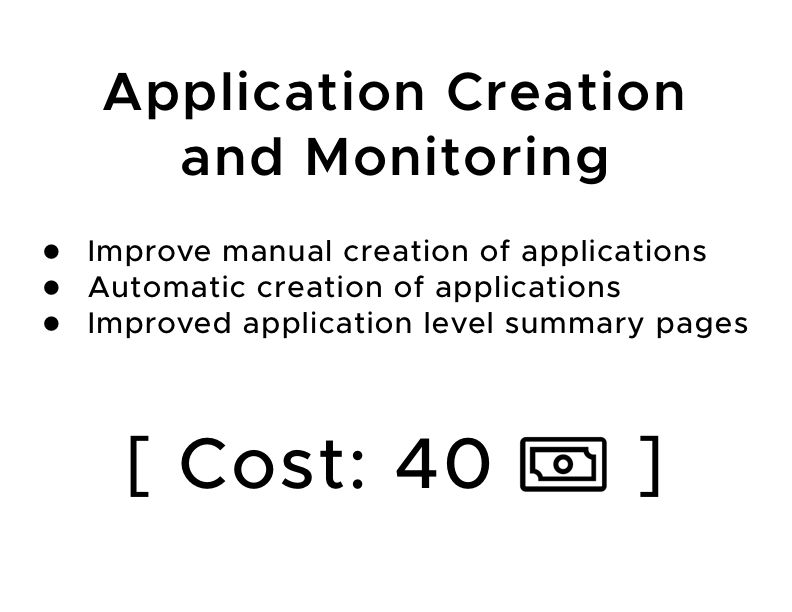
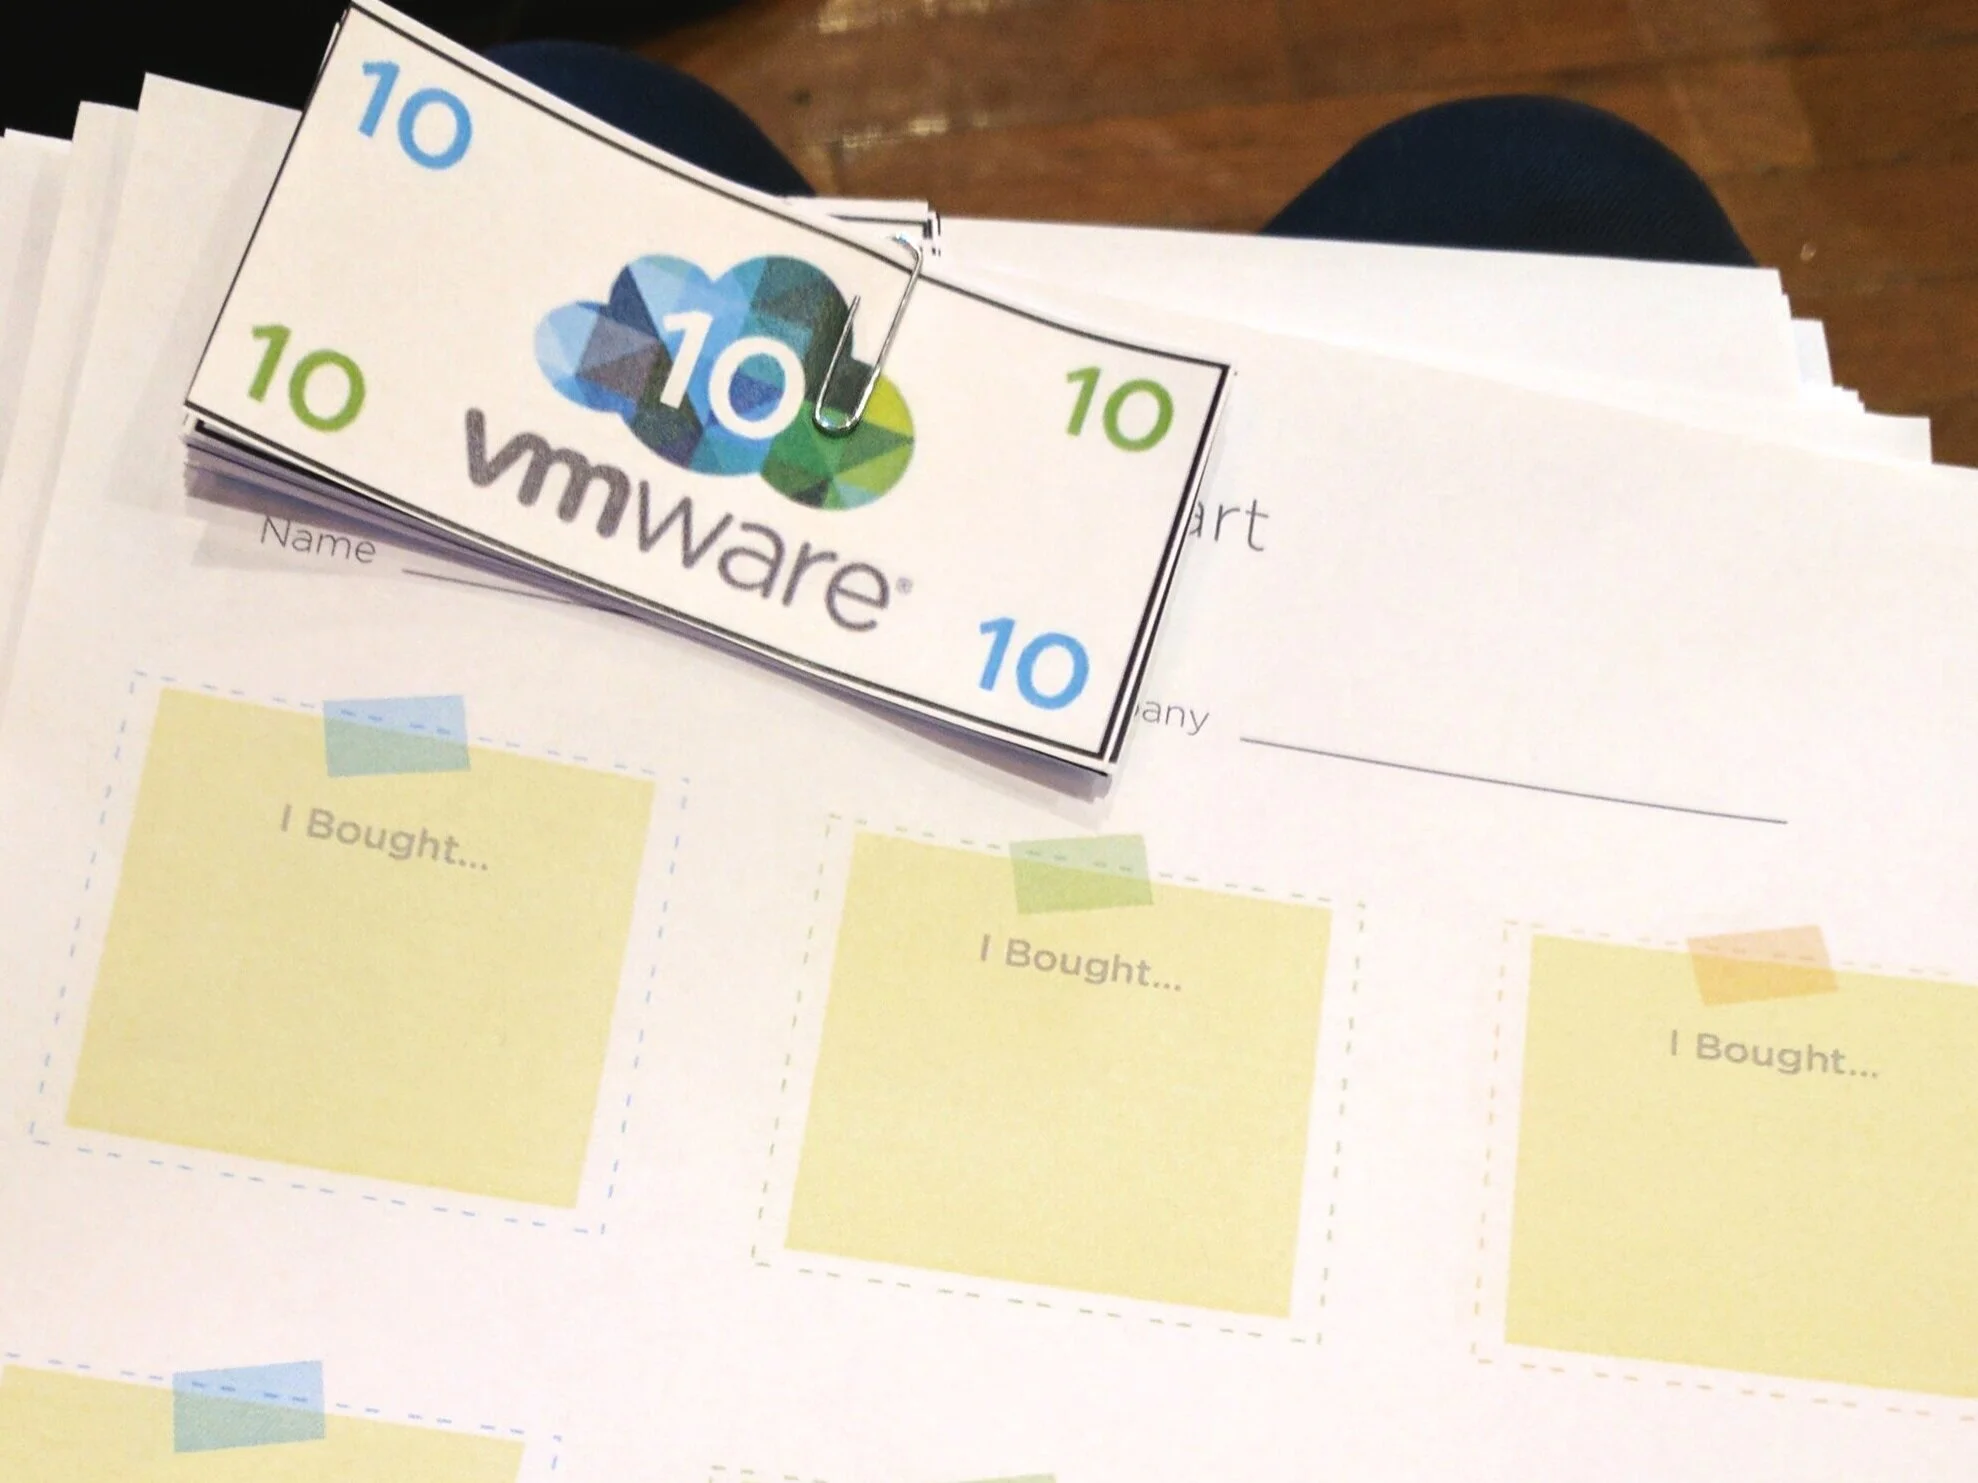
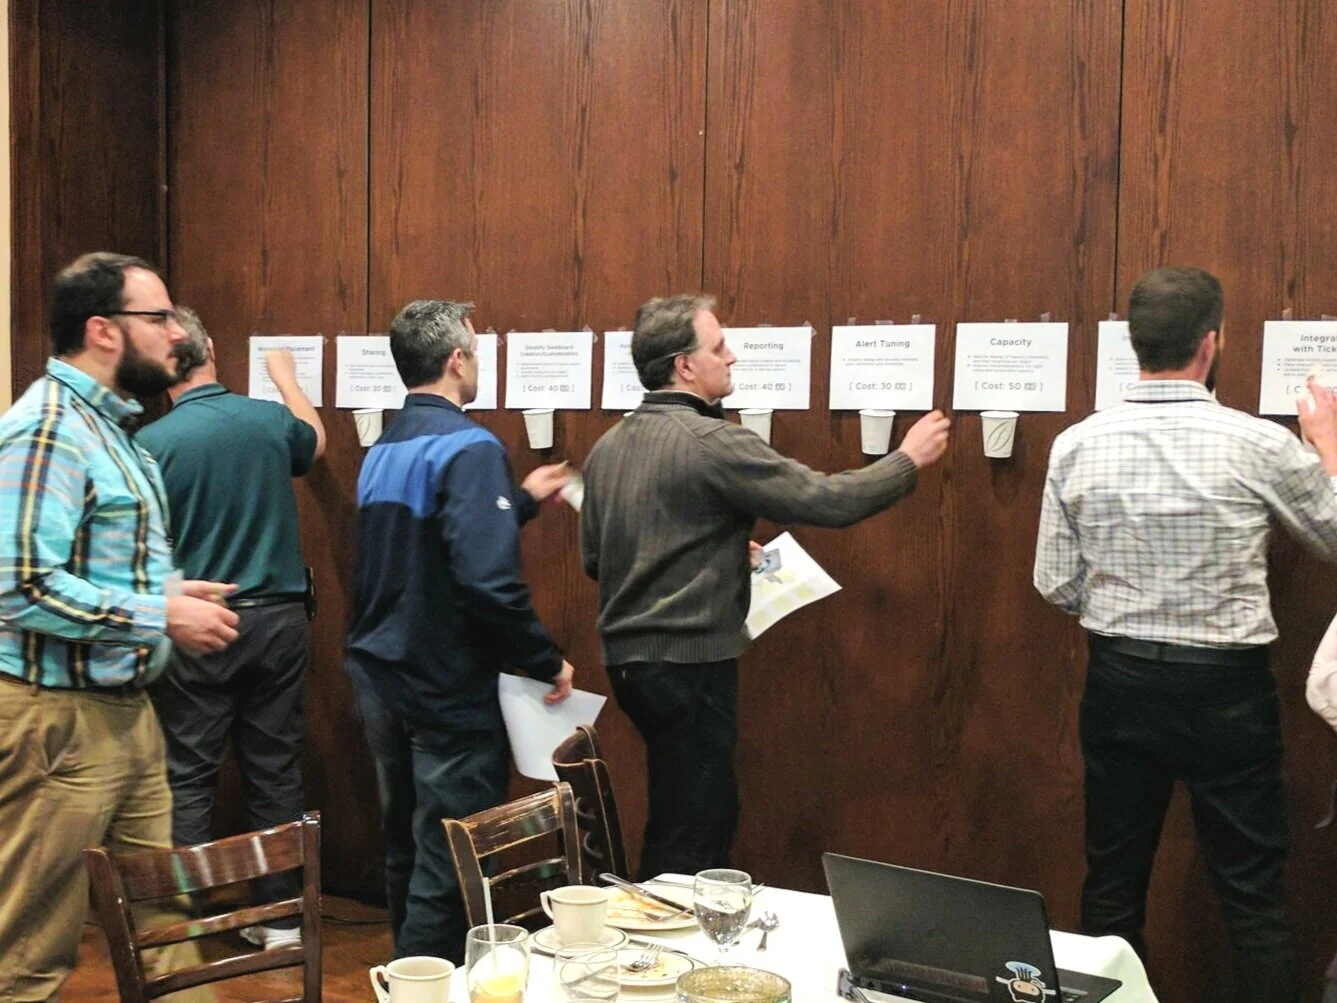
During release planning, we ran a buy a feature exercise with our users to understand what was most important to them. In this exercise, participants are given a set amount of money they can use to purchase which features they would want to see improved in the next release.
We collaborated with our product manager to create a list of common workflows and features inside vRealize Operations Manager. With that list, we worked with our engineering team to estimate development effort for each feature.
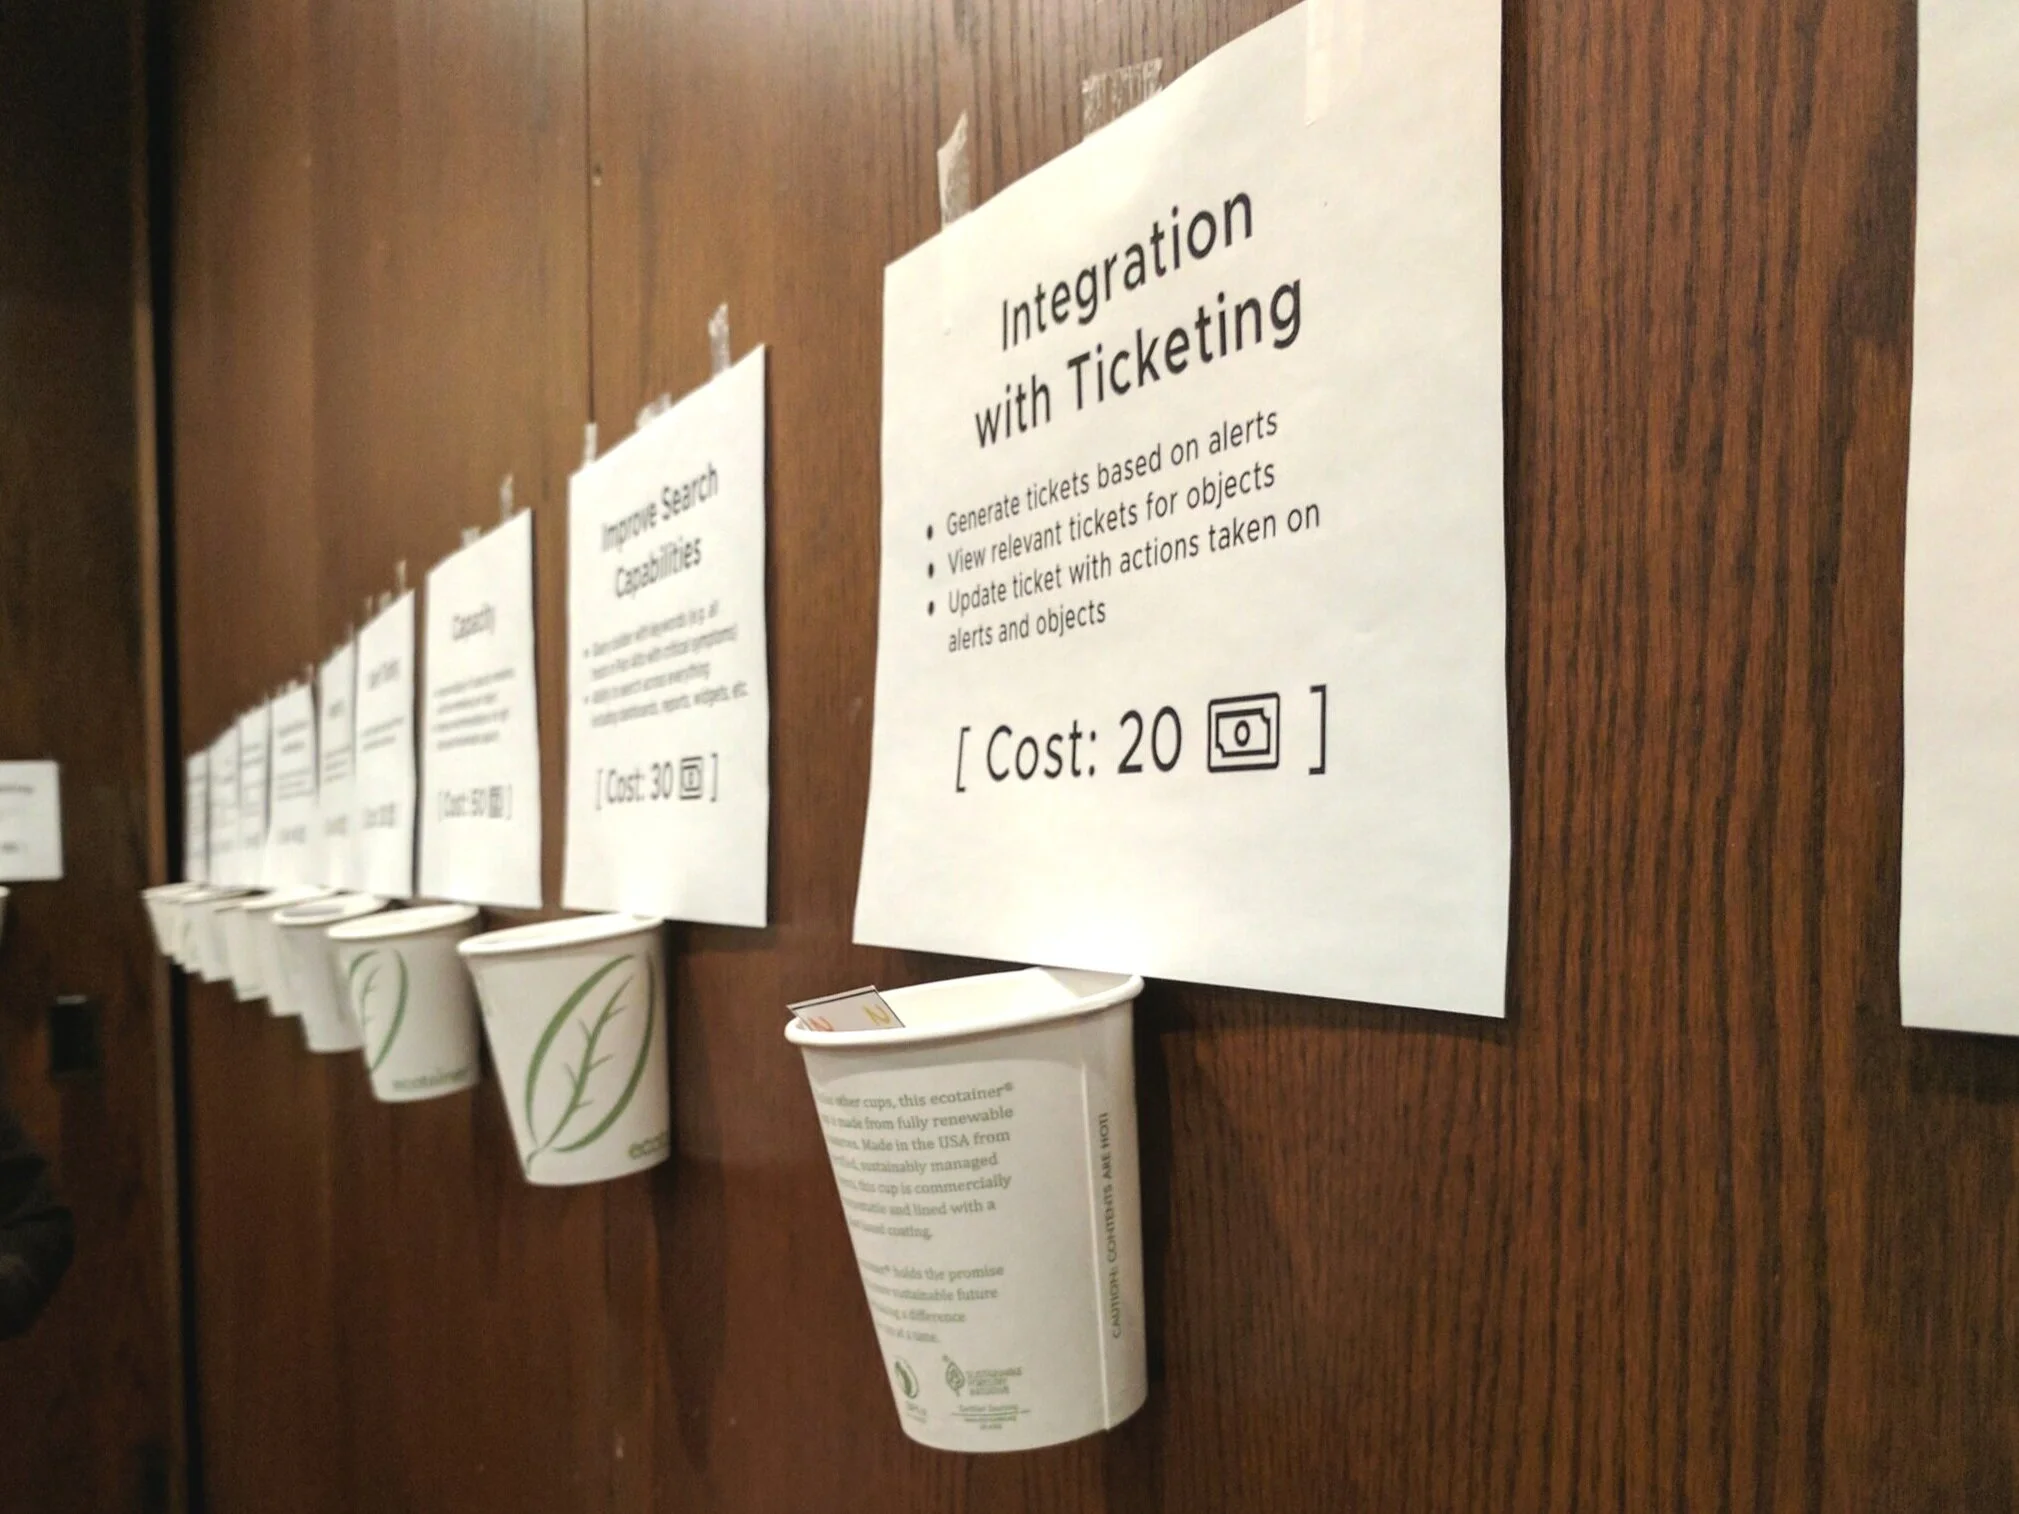
We were able to get 30+ of our existing users to participate in the exercise. During the exercise, we gave participants 100 dollars to spend. There were 15 items on the list, ranging between 20-50 dollars (depending on development effort), which meant each person was only able to choose 2-4 items. By constraining them in this way, the users really have to stop and weigh their options.
For each item they bought, we asked the participant to put the money into the respective bucket and also note down why they purchased it. At the end of the activity, we counted how much each item got and ranked them accordingly. The top three items users wanted improvement on were:
Capacity
Reporting
Troubleshooting
Based on this data, we chose to focus on capacity for the release. In the context of vRealize Operations Manager, this means capacity management of a user’s virtual infrastructure, making sure there’s enough CPU, memory, and storage to properly support all their virtual machines. Currently, there are some features inside the product to help users with capacity planning, but there isn’t a clearly defined flow.
GATHERING USER DATA
User Interviews
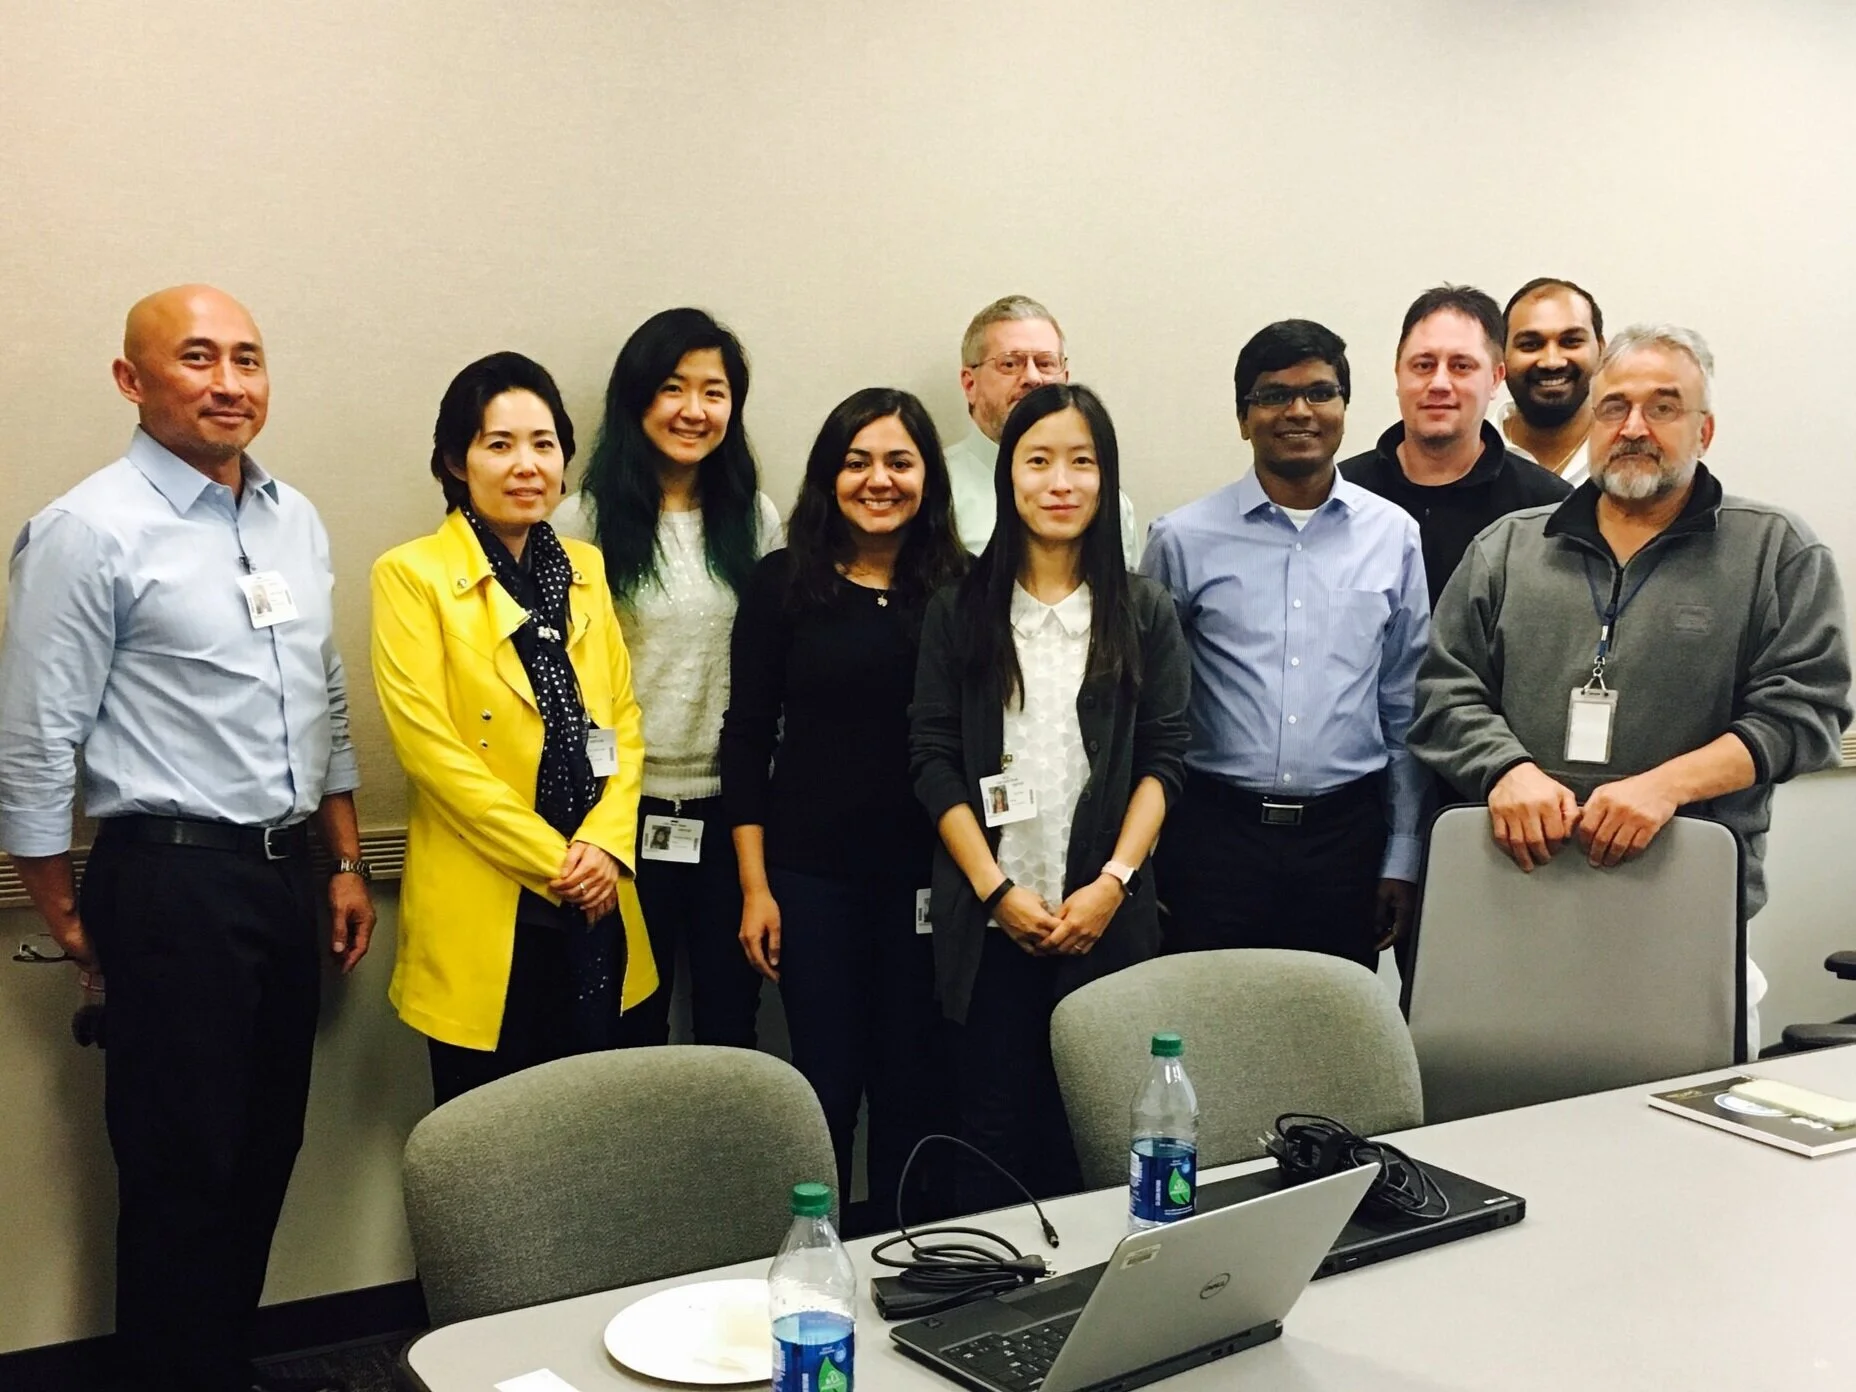
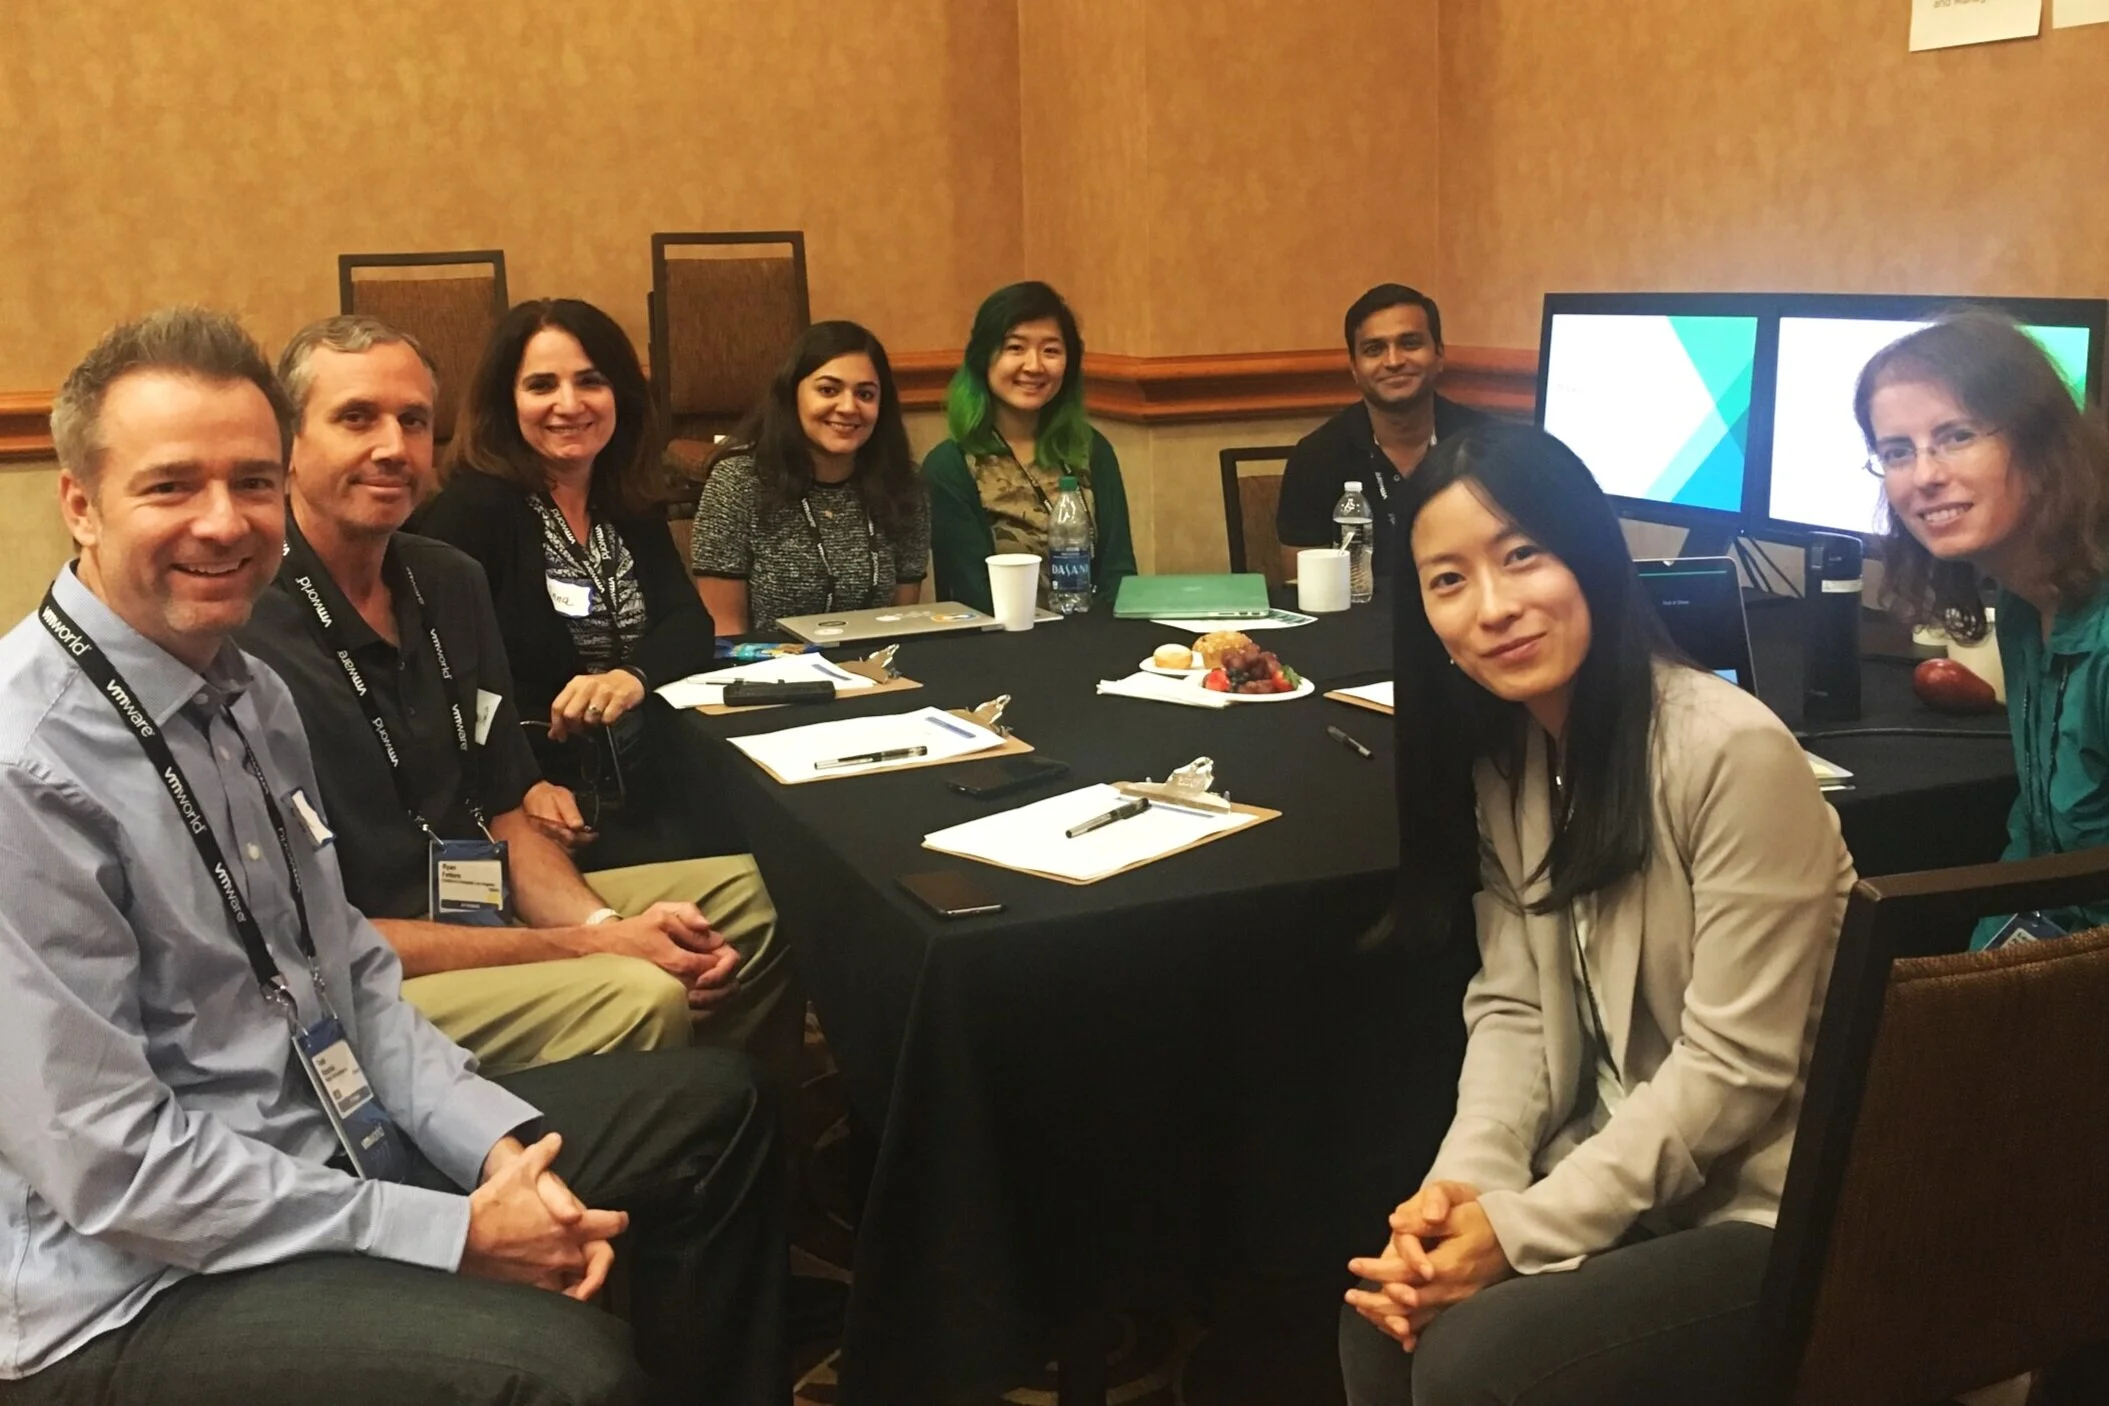
Our team of design, research, and product management alongside one of our customer's virtual infrastructure team during an on-site research session.
To gather more specific user insights on how they manage capacity, our team went on-site to interview different teams. It was a great opportunity because we were able to talk to an entire virtual infrastructure team at once and understand not only their day to day work but also the team dynamic.
We asked the teams to walk us through how they complete their capacity management tasks today and to note some of the frustrations they face. Many of the teams used spreadsheets and custom tools on top of vRealize Operations to get all the information they need, but they all really wanted a consolidated view and flow to manage everything.
Defining a New Persona
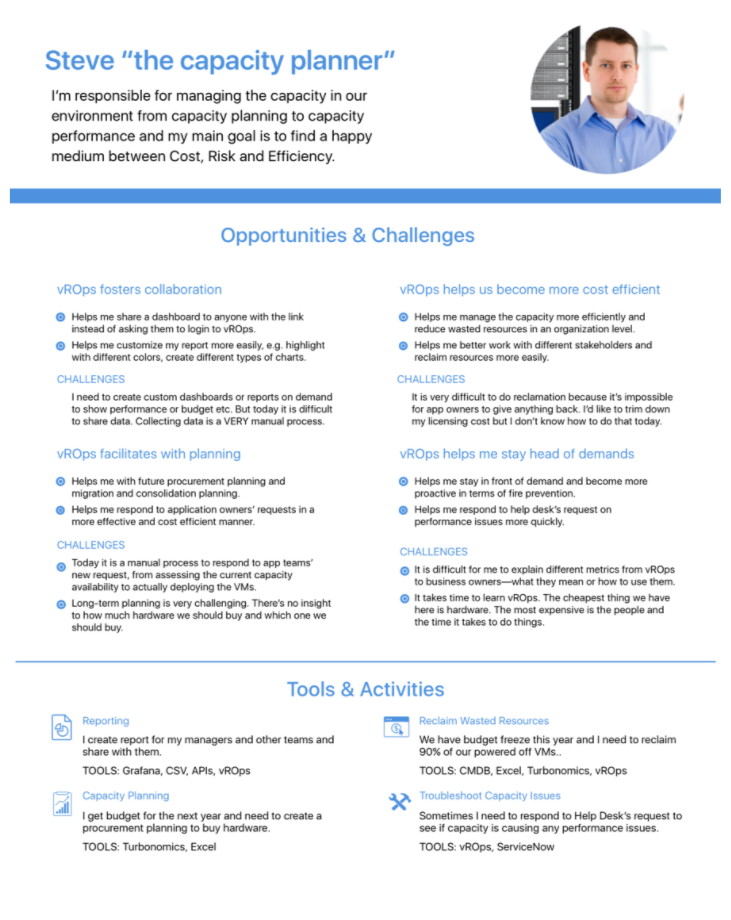
As we talked to the teams, we also noticed there was often a specific team member who was the main point of contact for capacity needs and issues. Based on our observations and the users’ descriptions of their tasks, we created a new persona, the capacity planner.
We took a look at our users’ specific feedback, discussed business priorities with our PMs, and agreed the scope of this release will cover the following three workflows:
Pain Point Synthesis
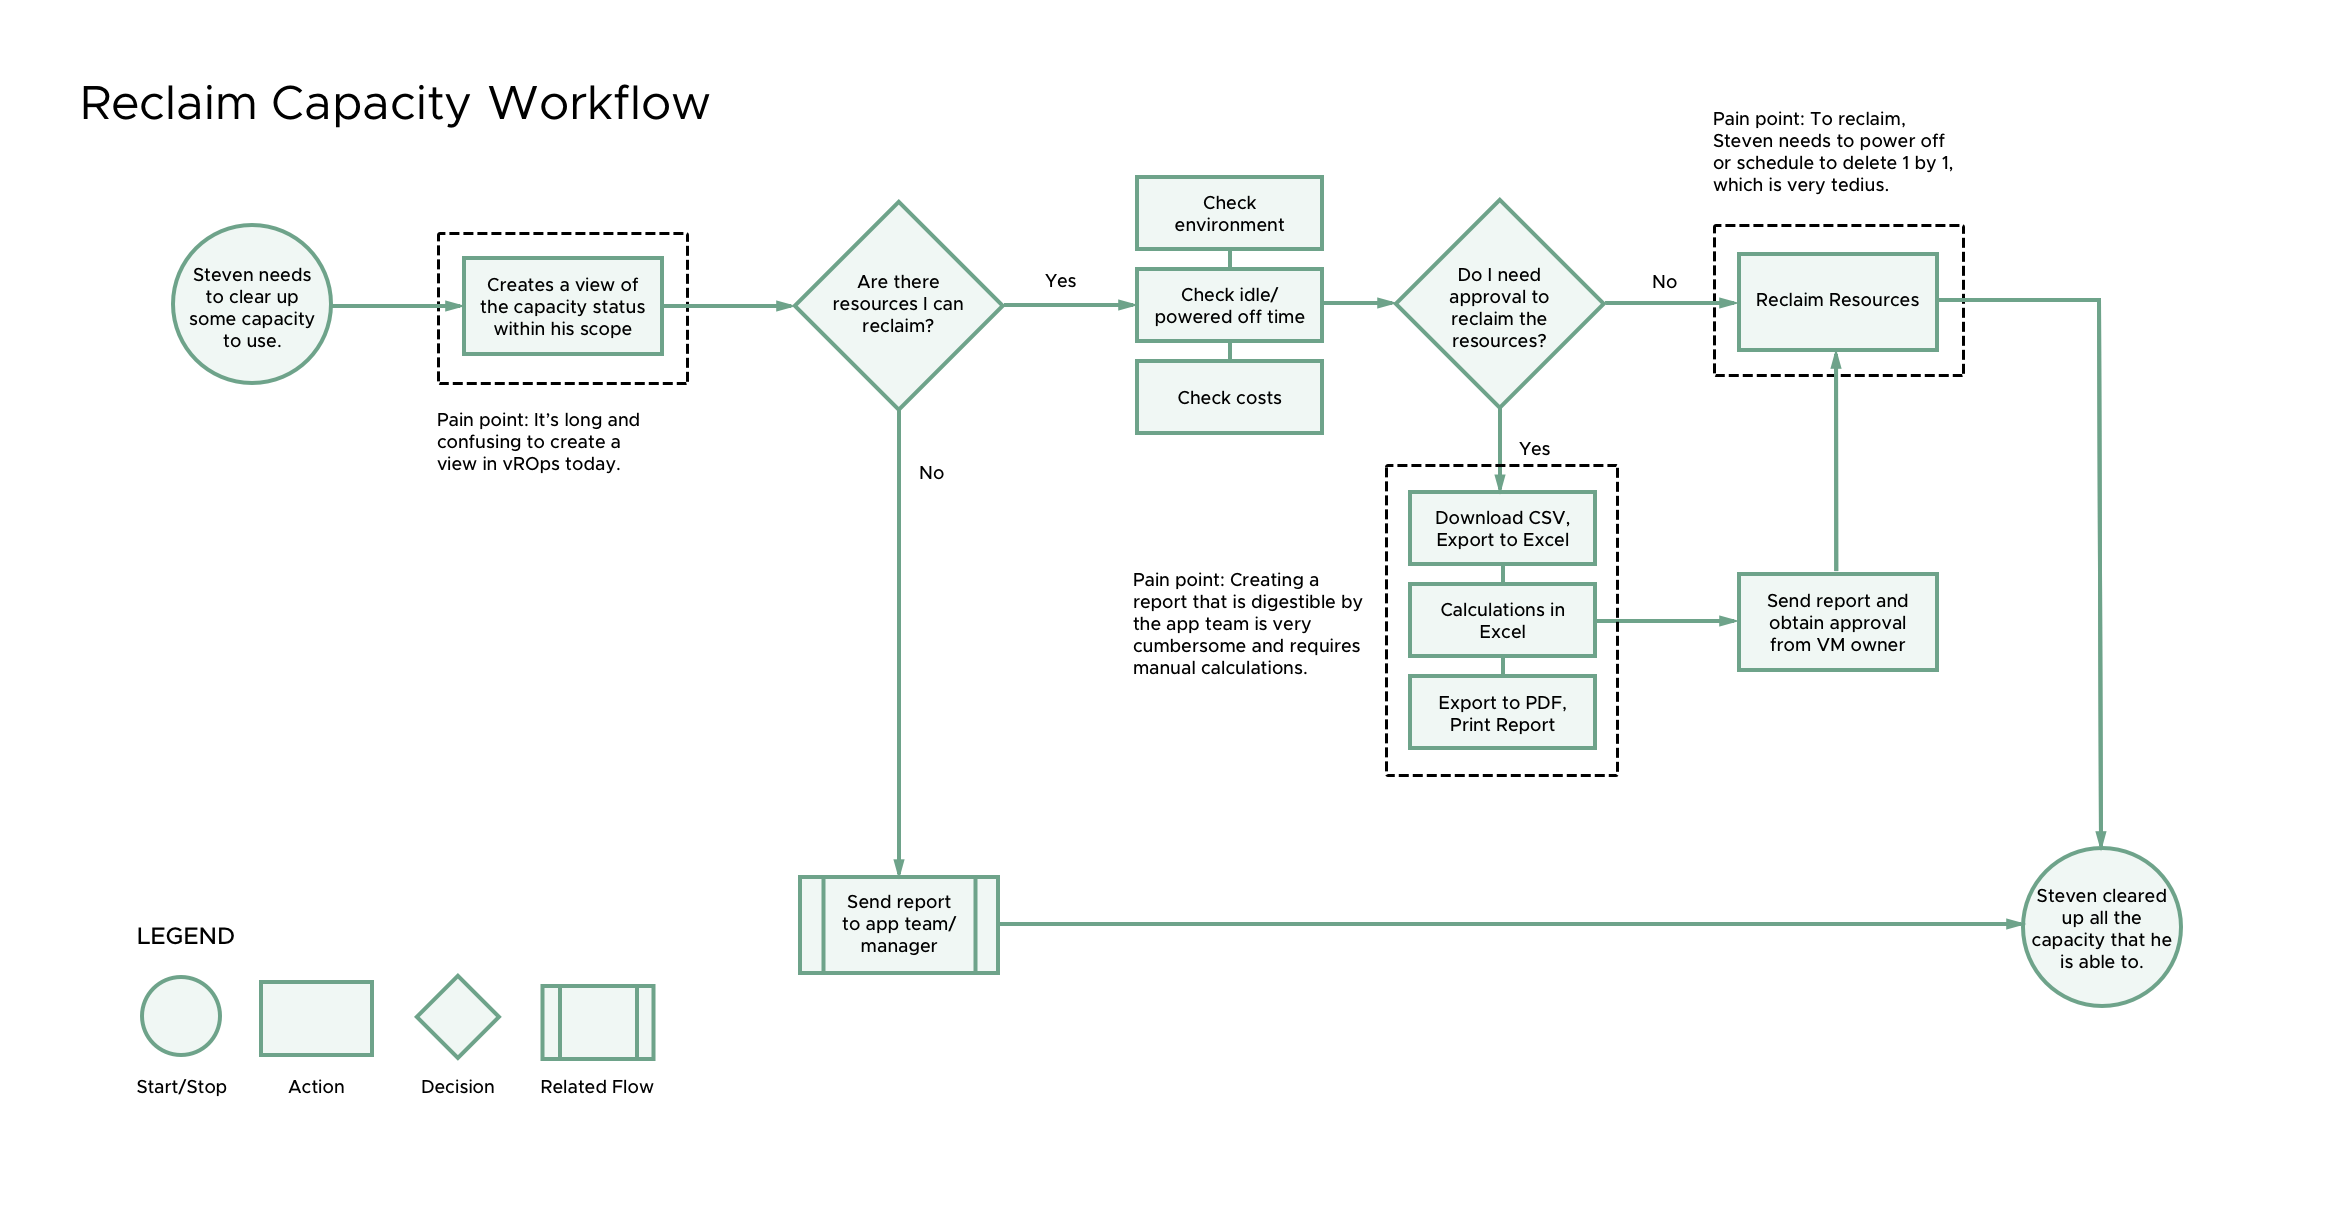
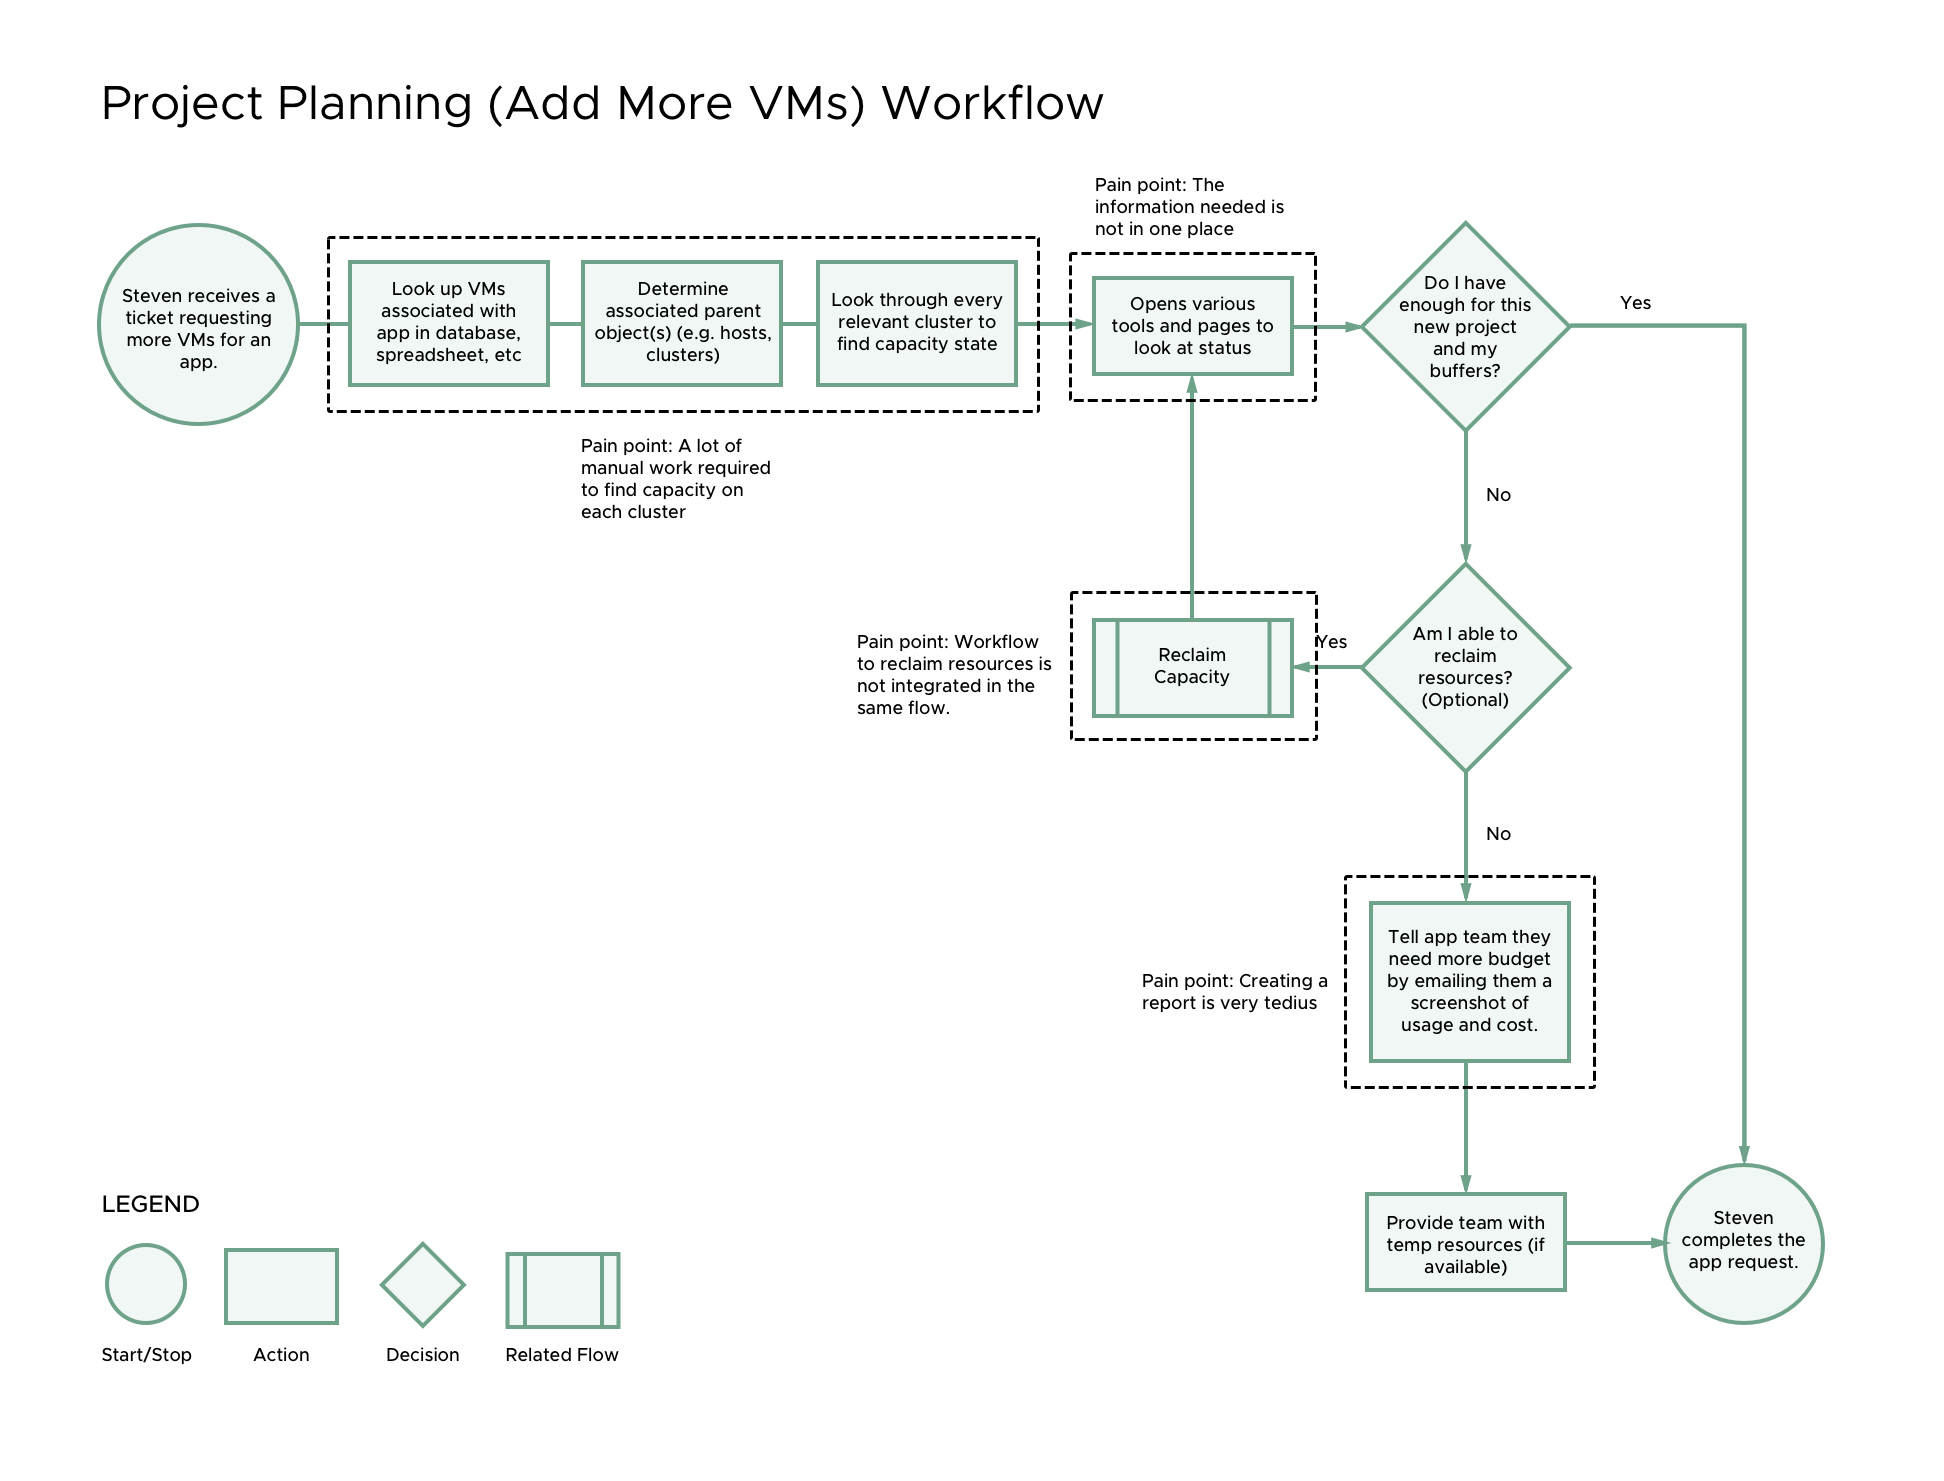
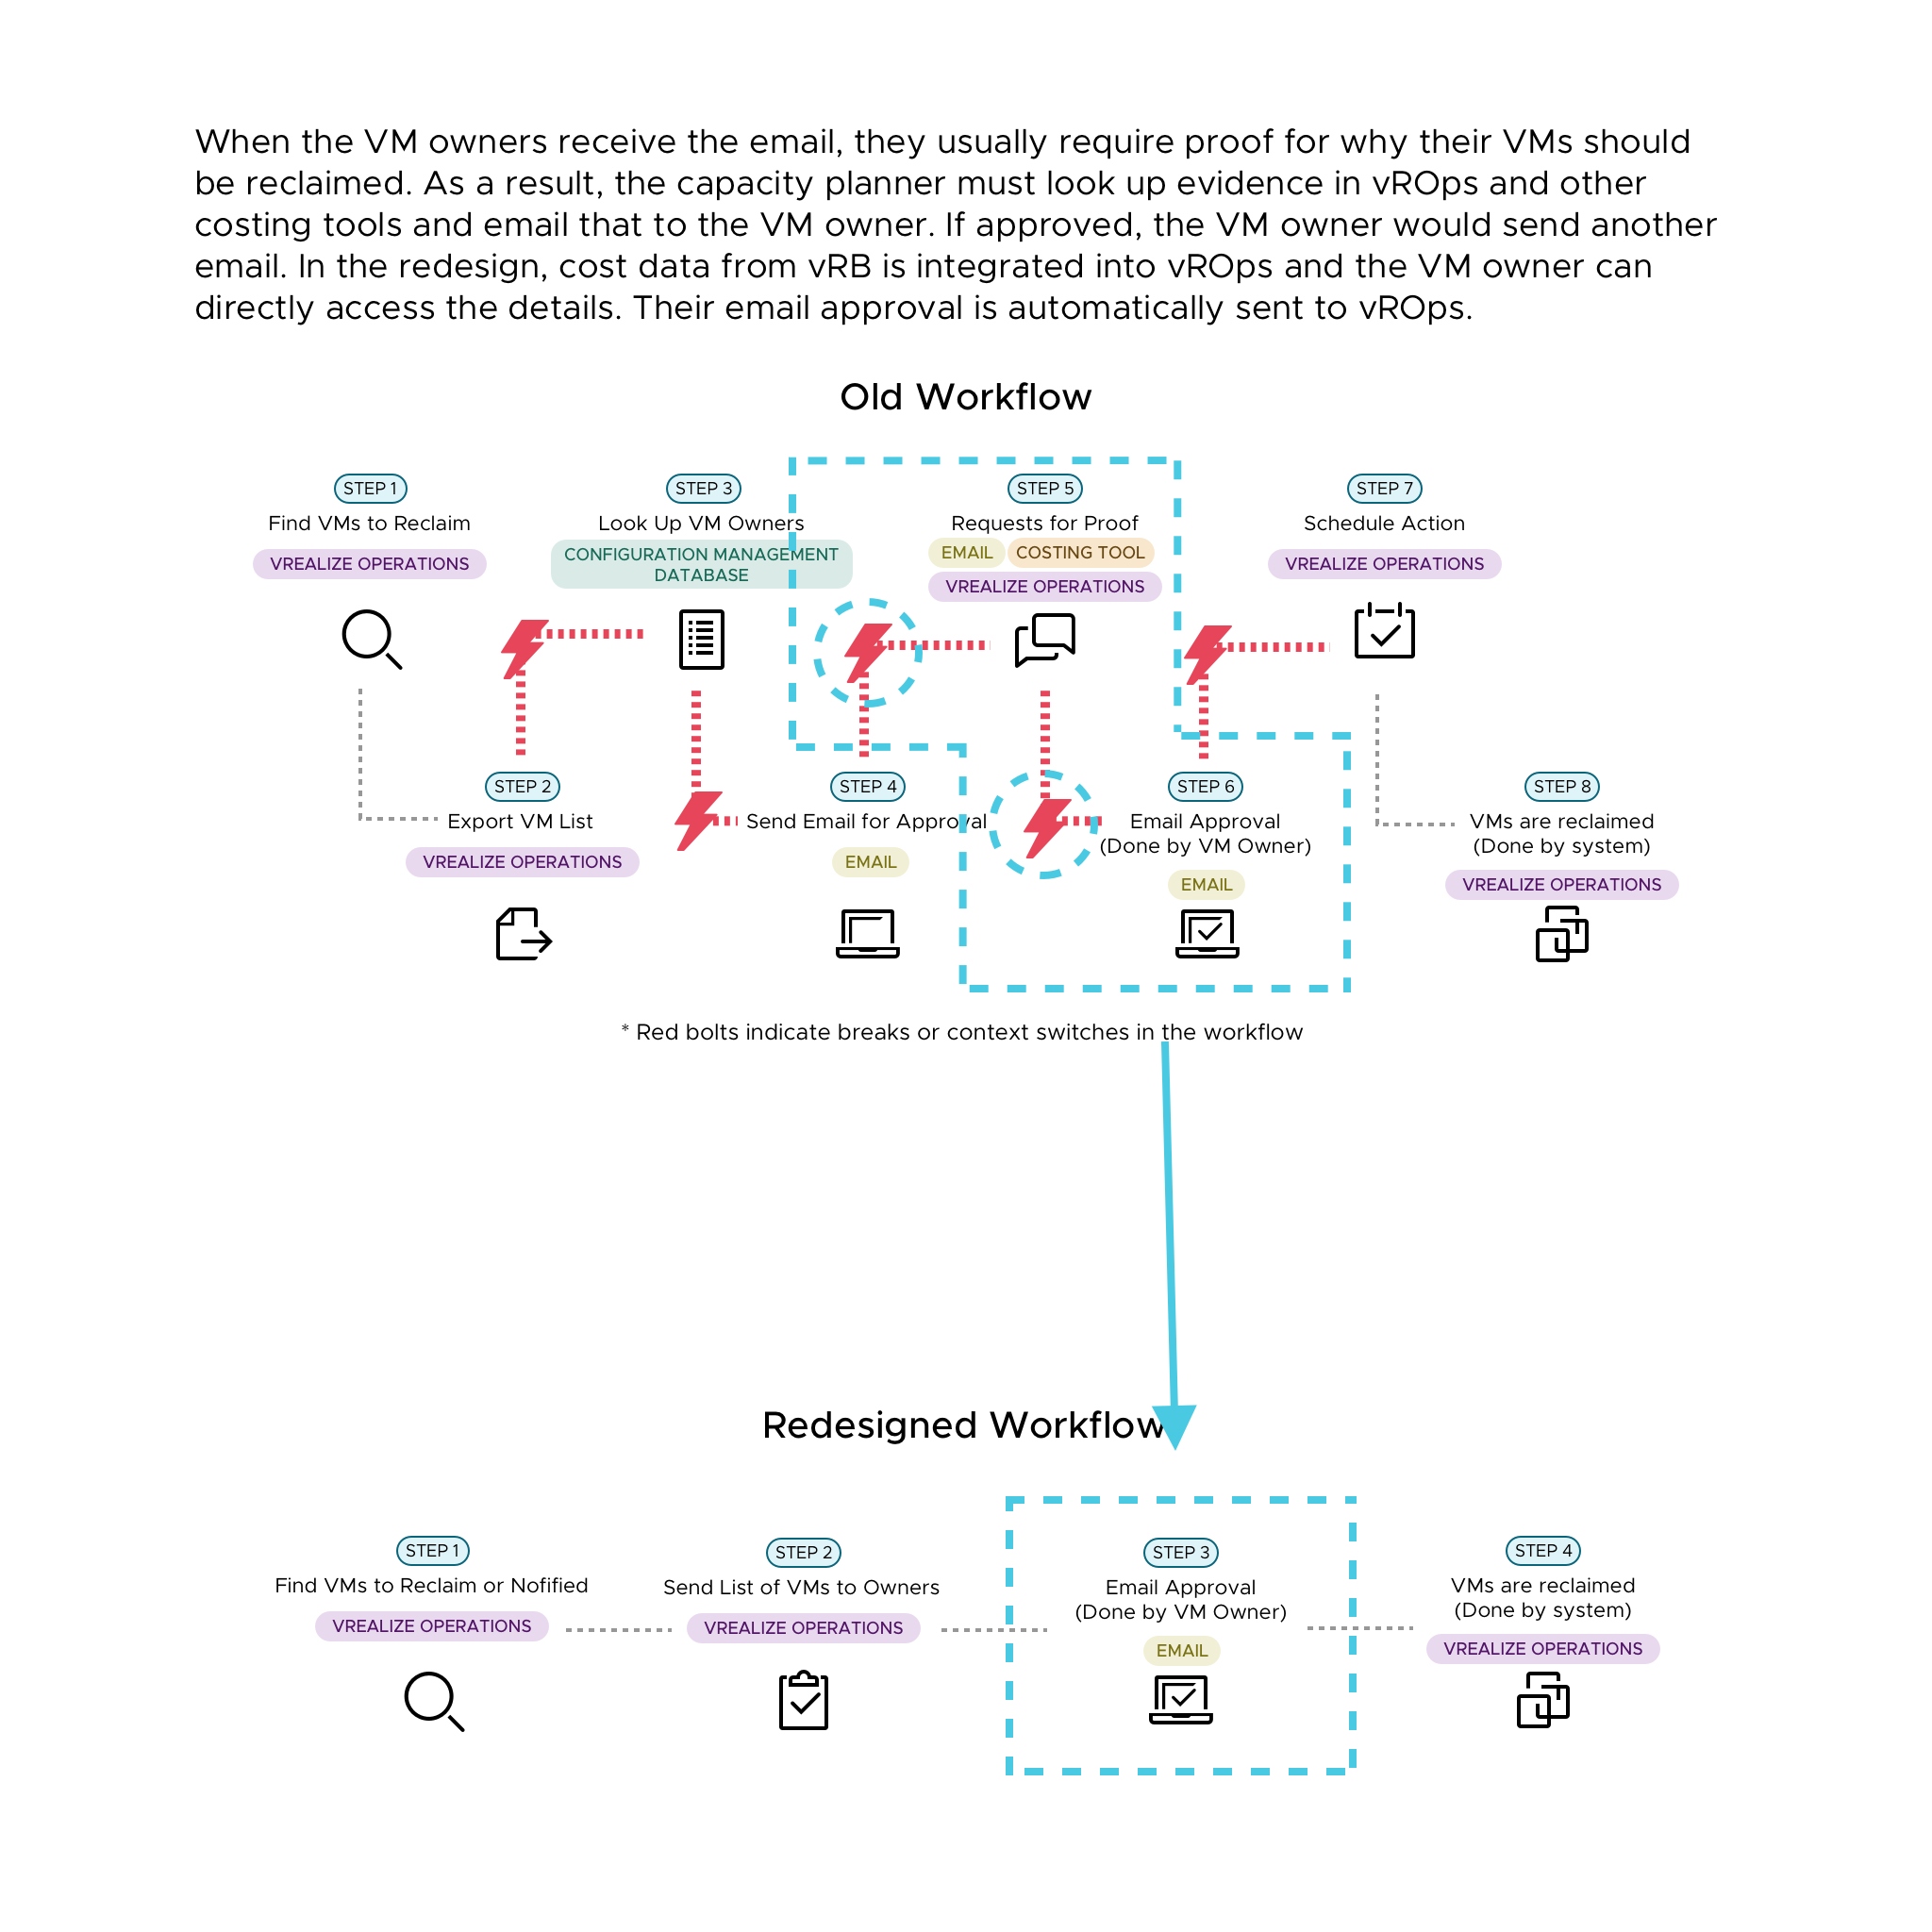
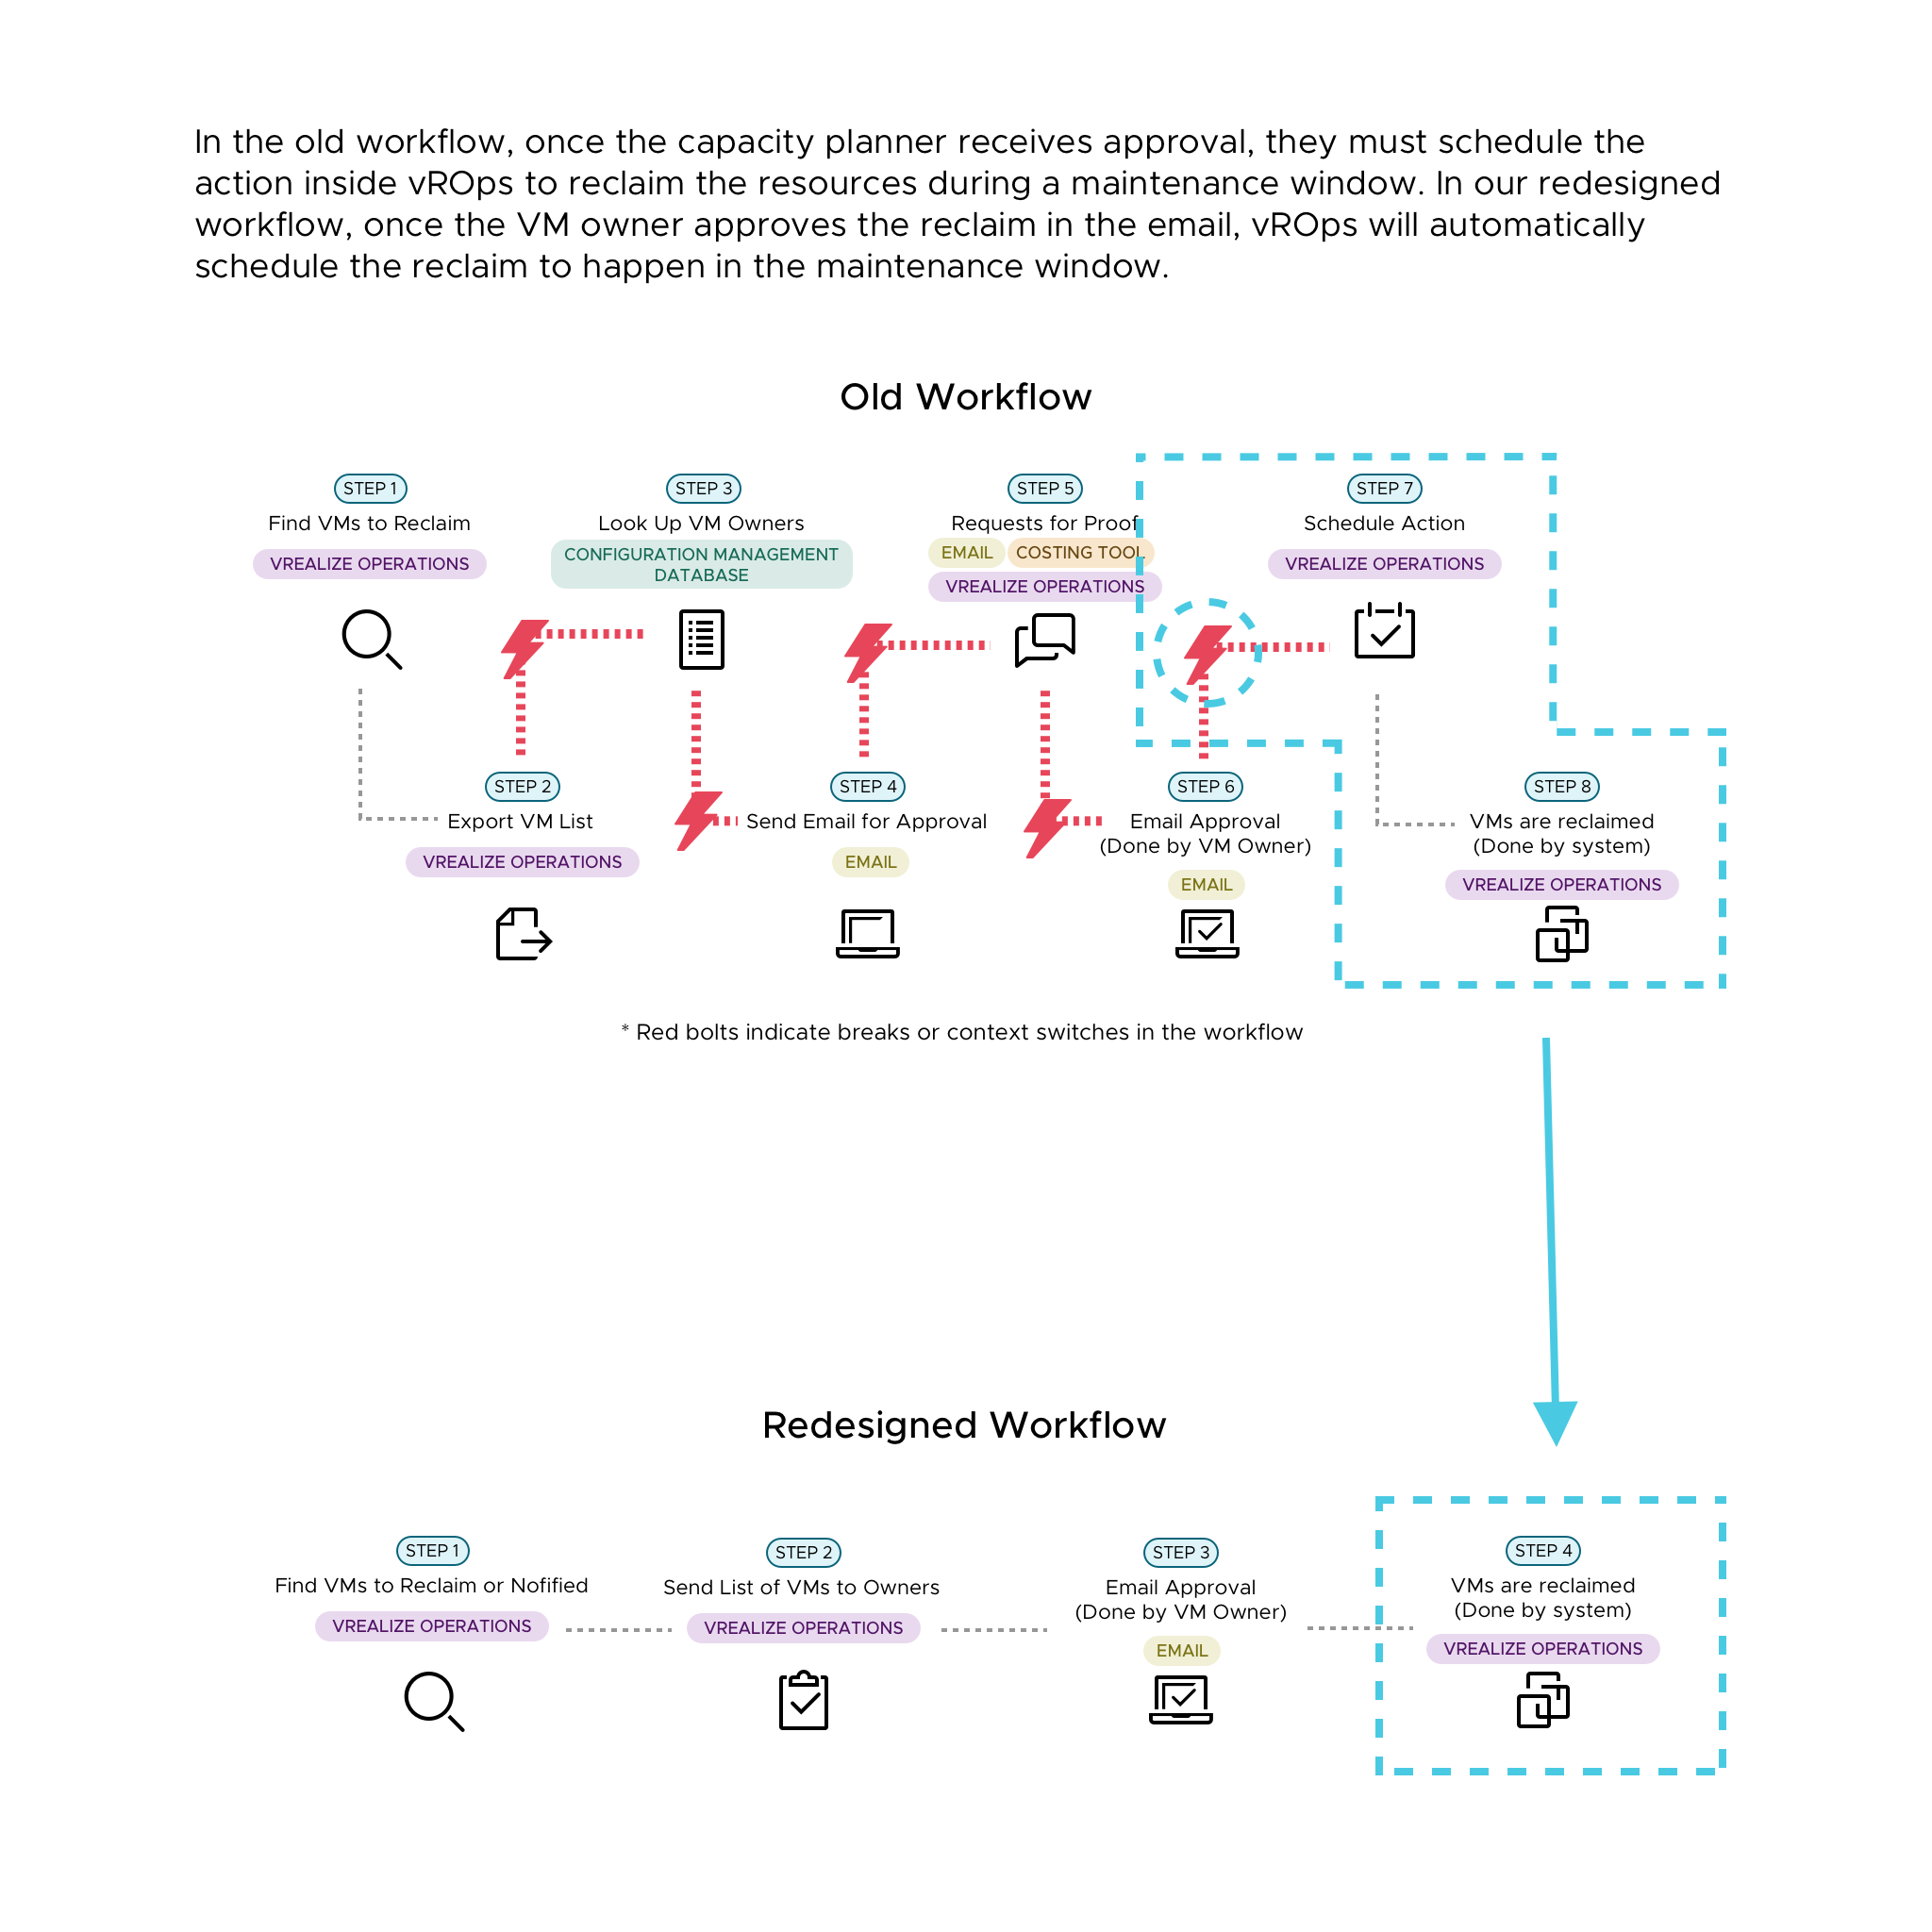
We took the data we gathered and defined existing user workflows. We highlighted where along these workflows our users most often encountered pain points. Below are the as-is flows that identify key pain points in the reclaiming resources and project planning workflows:
Existing reclaiming capacity workflow, with pain points highlighted by the dotted boxes
Existing project planning workflow, with pain points highlighted by the dotted boxes
Overall, we found users were struggling with:
Too much context switching; information needed is not in one place
Tedious and manual work; a lot of repetitive tasks were required
Too many tools; users had to access other tools like Excel to properly calculate information
design sprints and IDEATION
We ran a two-week design sprint for each of the three areas we were tackling.
For each workflow, we did the following:
Since we had 3 product designers and 3 workflows, we would brainstorm and converge on ideas together, then split up the flows to update more detailed designs. All three of us worked on every flow interchangeably.
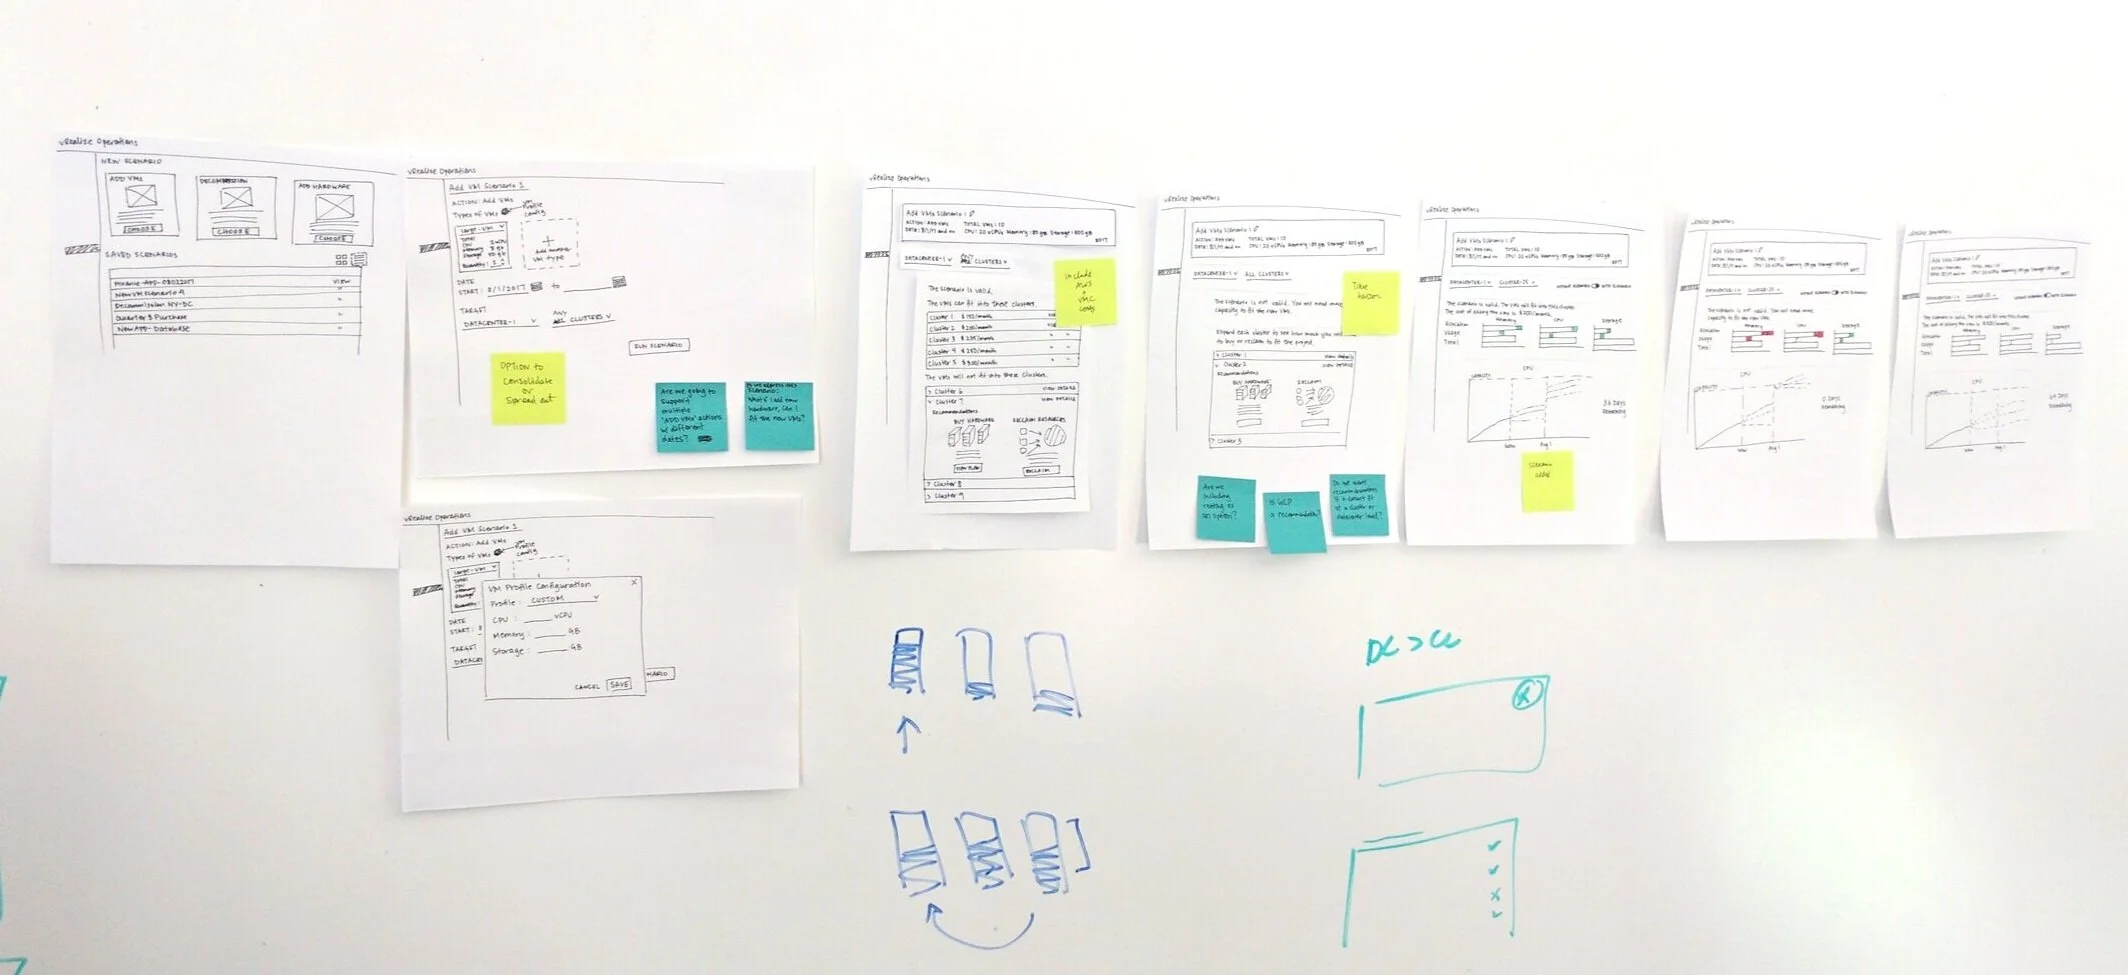
Paper prototypes for quick iteration.
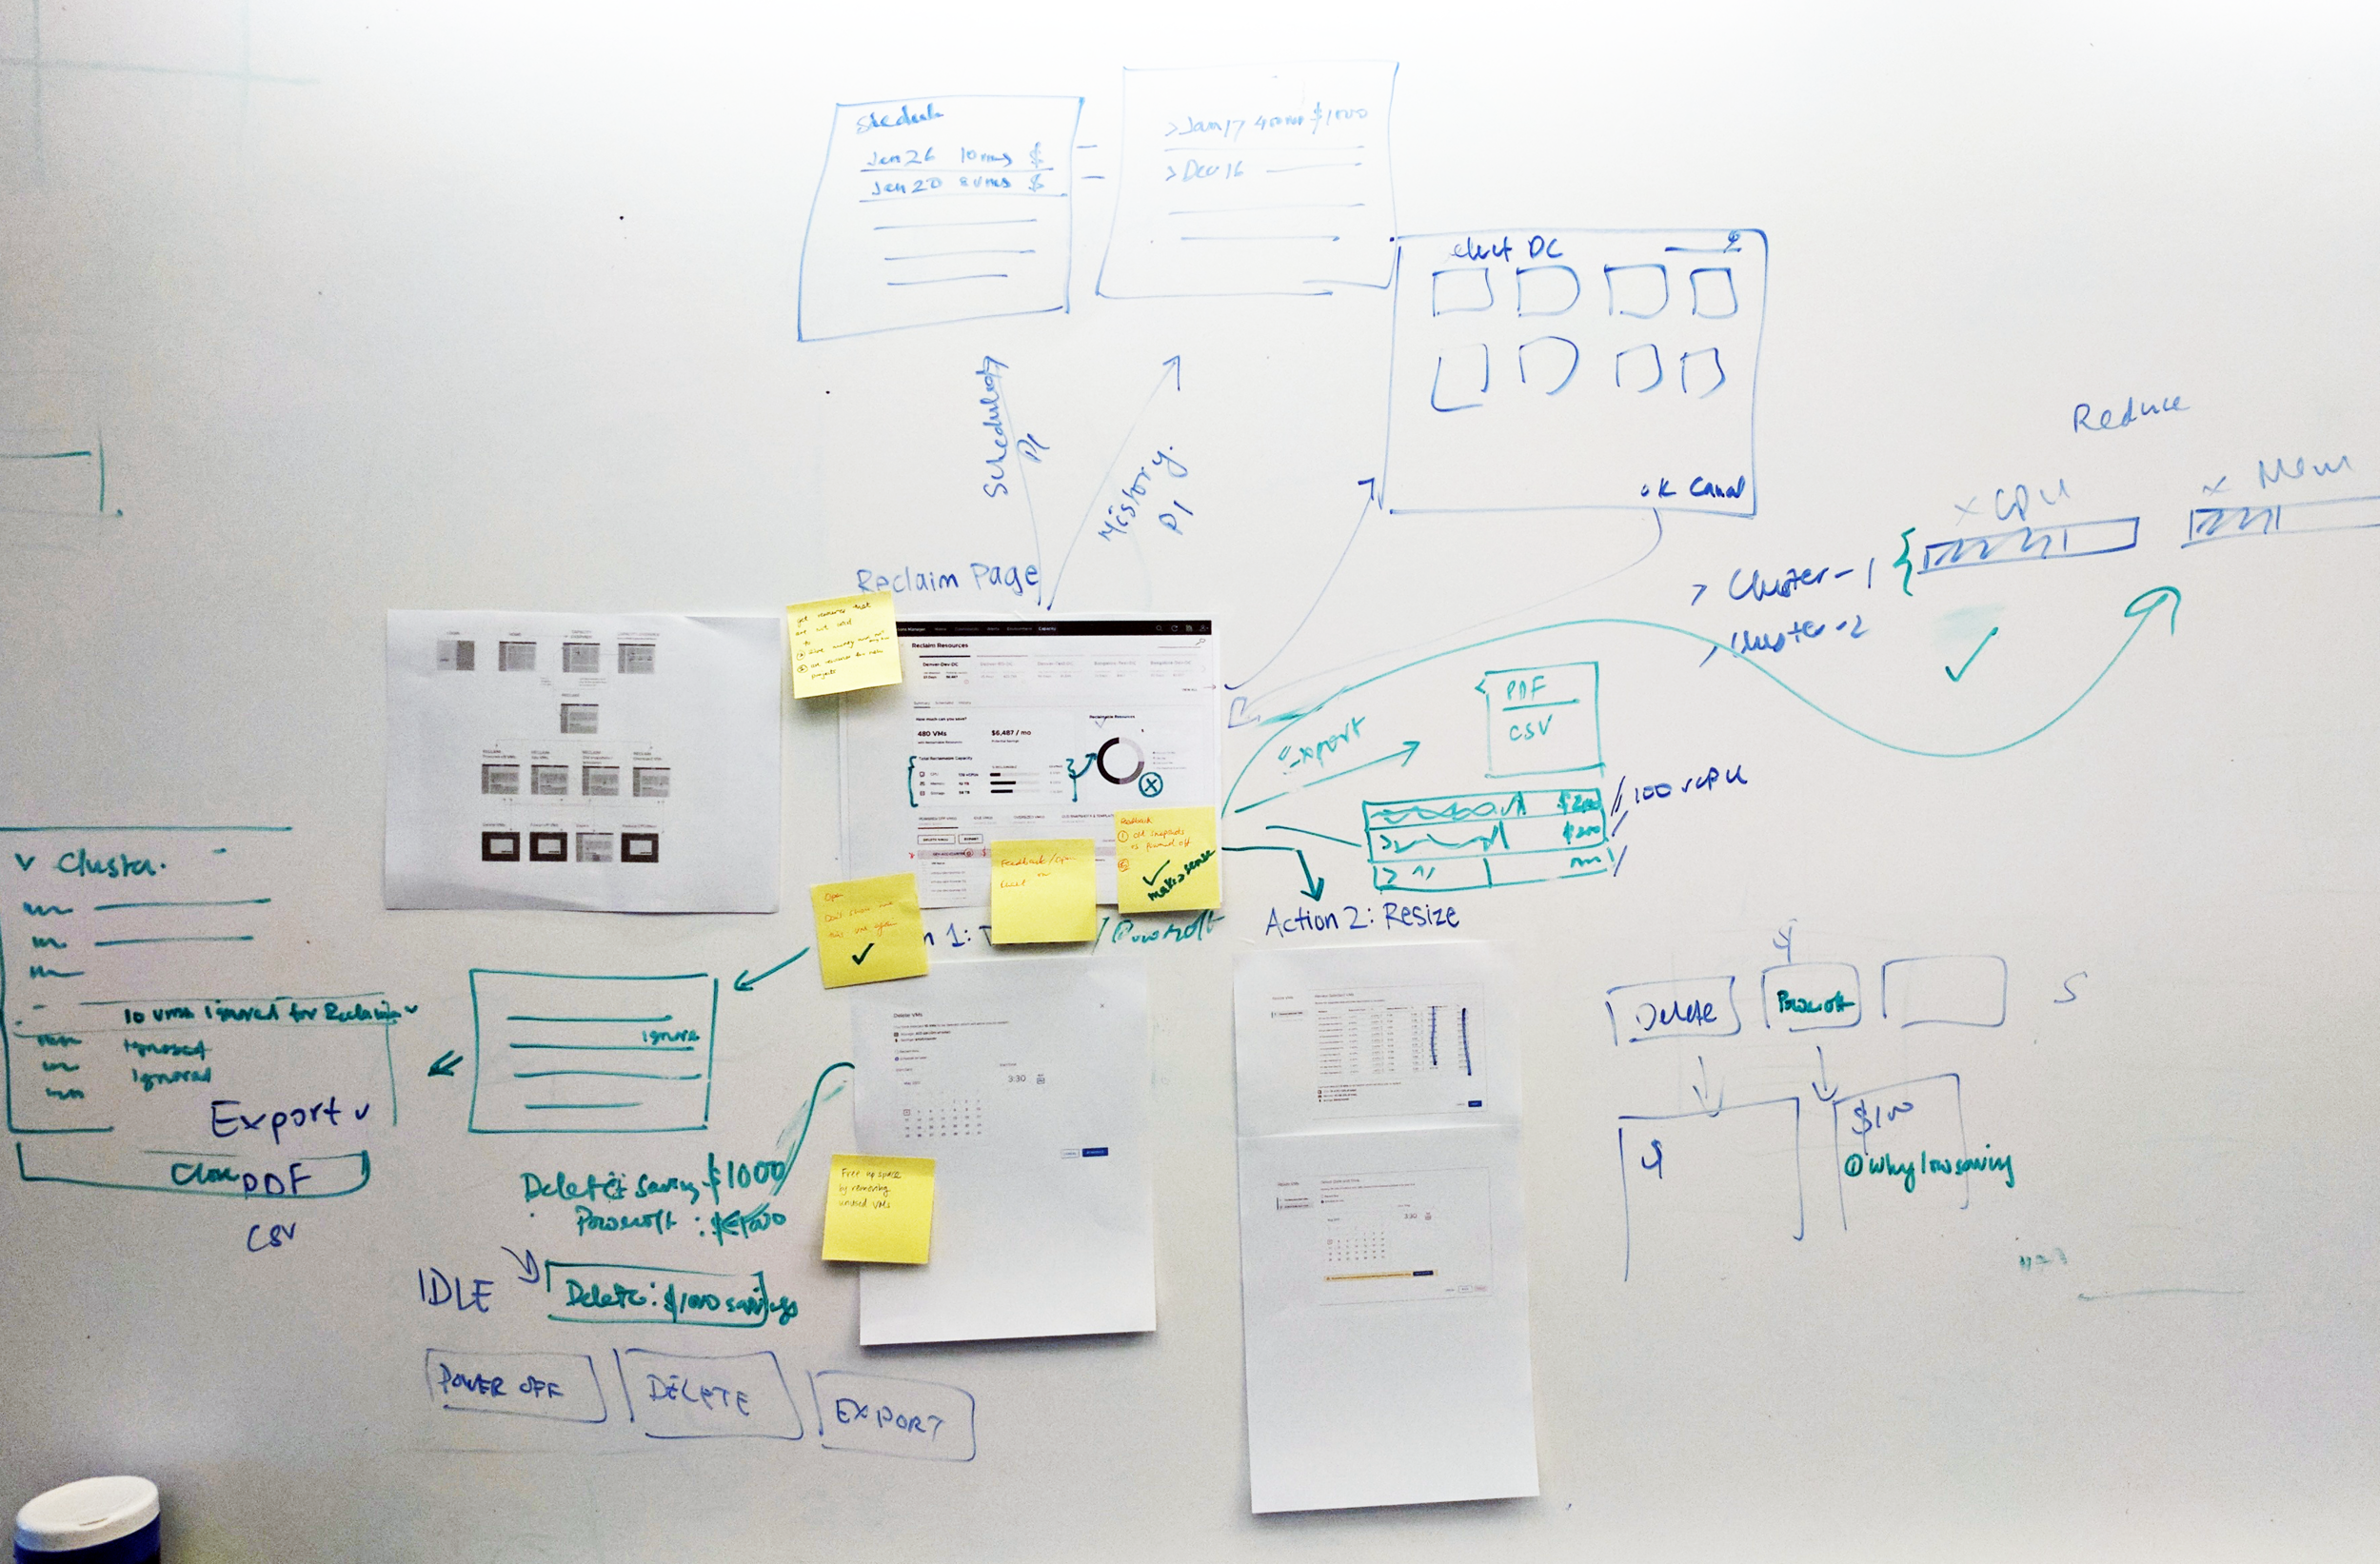
One of the whiteboarding sessions we had during the design sprint. We printed out the lo-fi mockups for discussion and allowed ideas to branch from it.
Visualizing an Algorithm
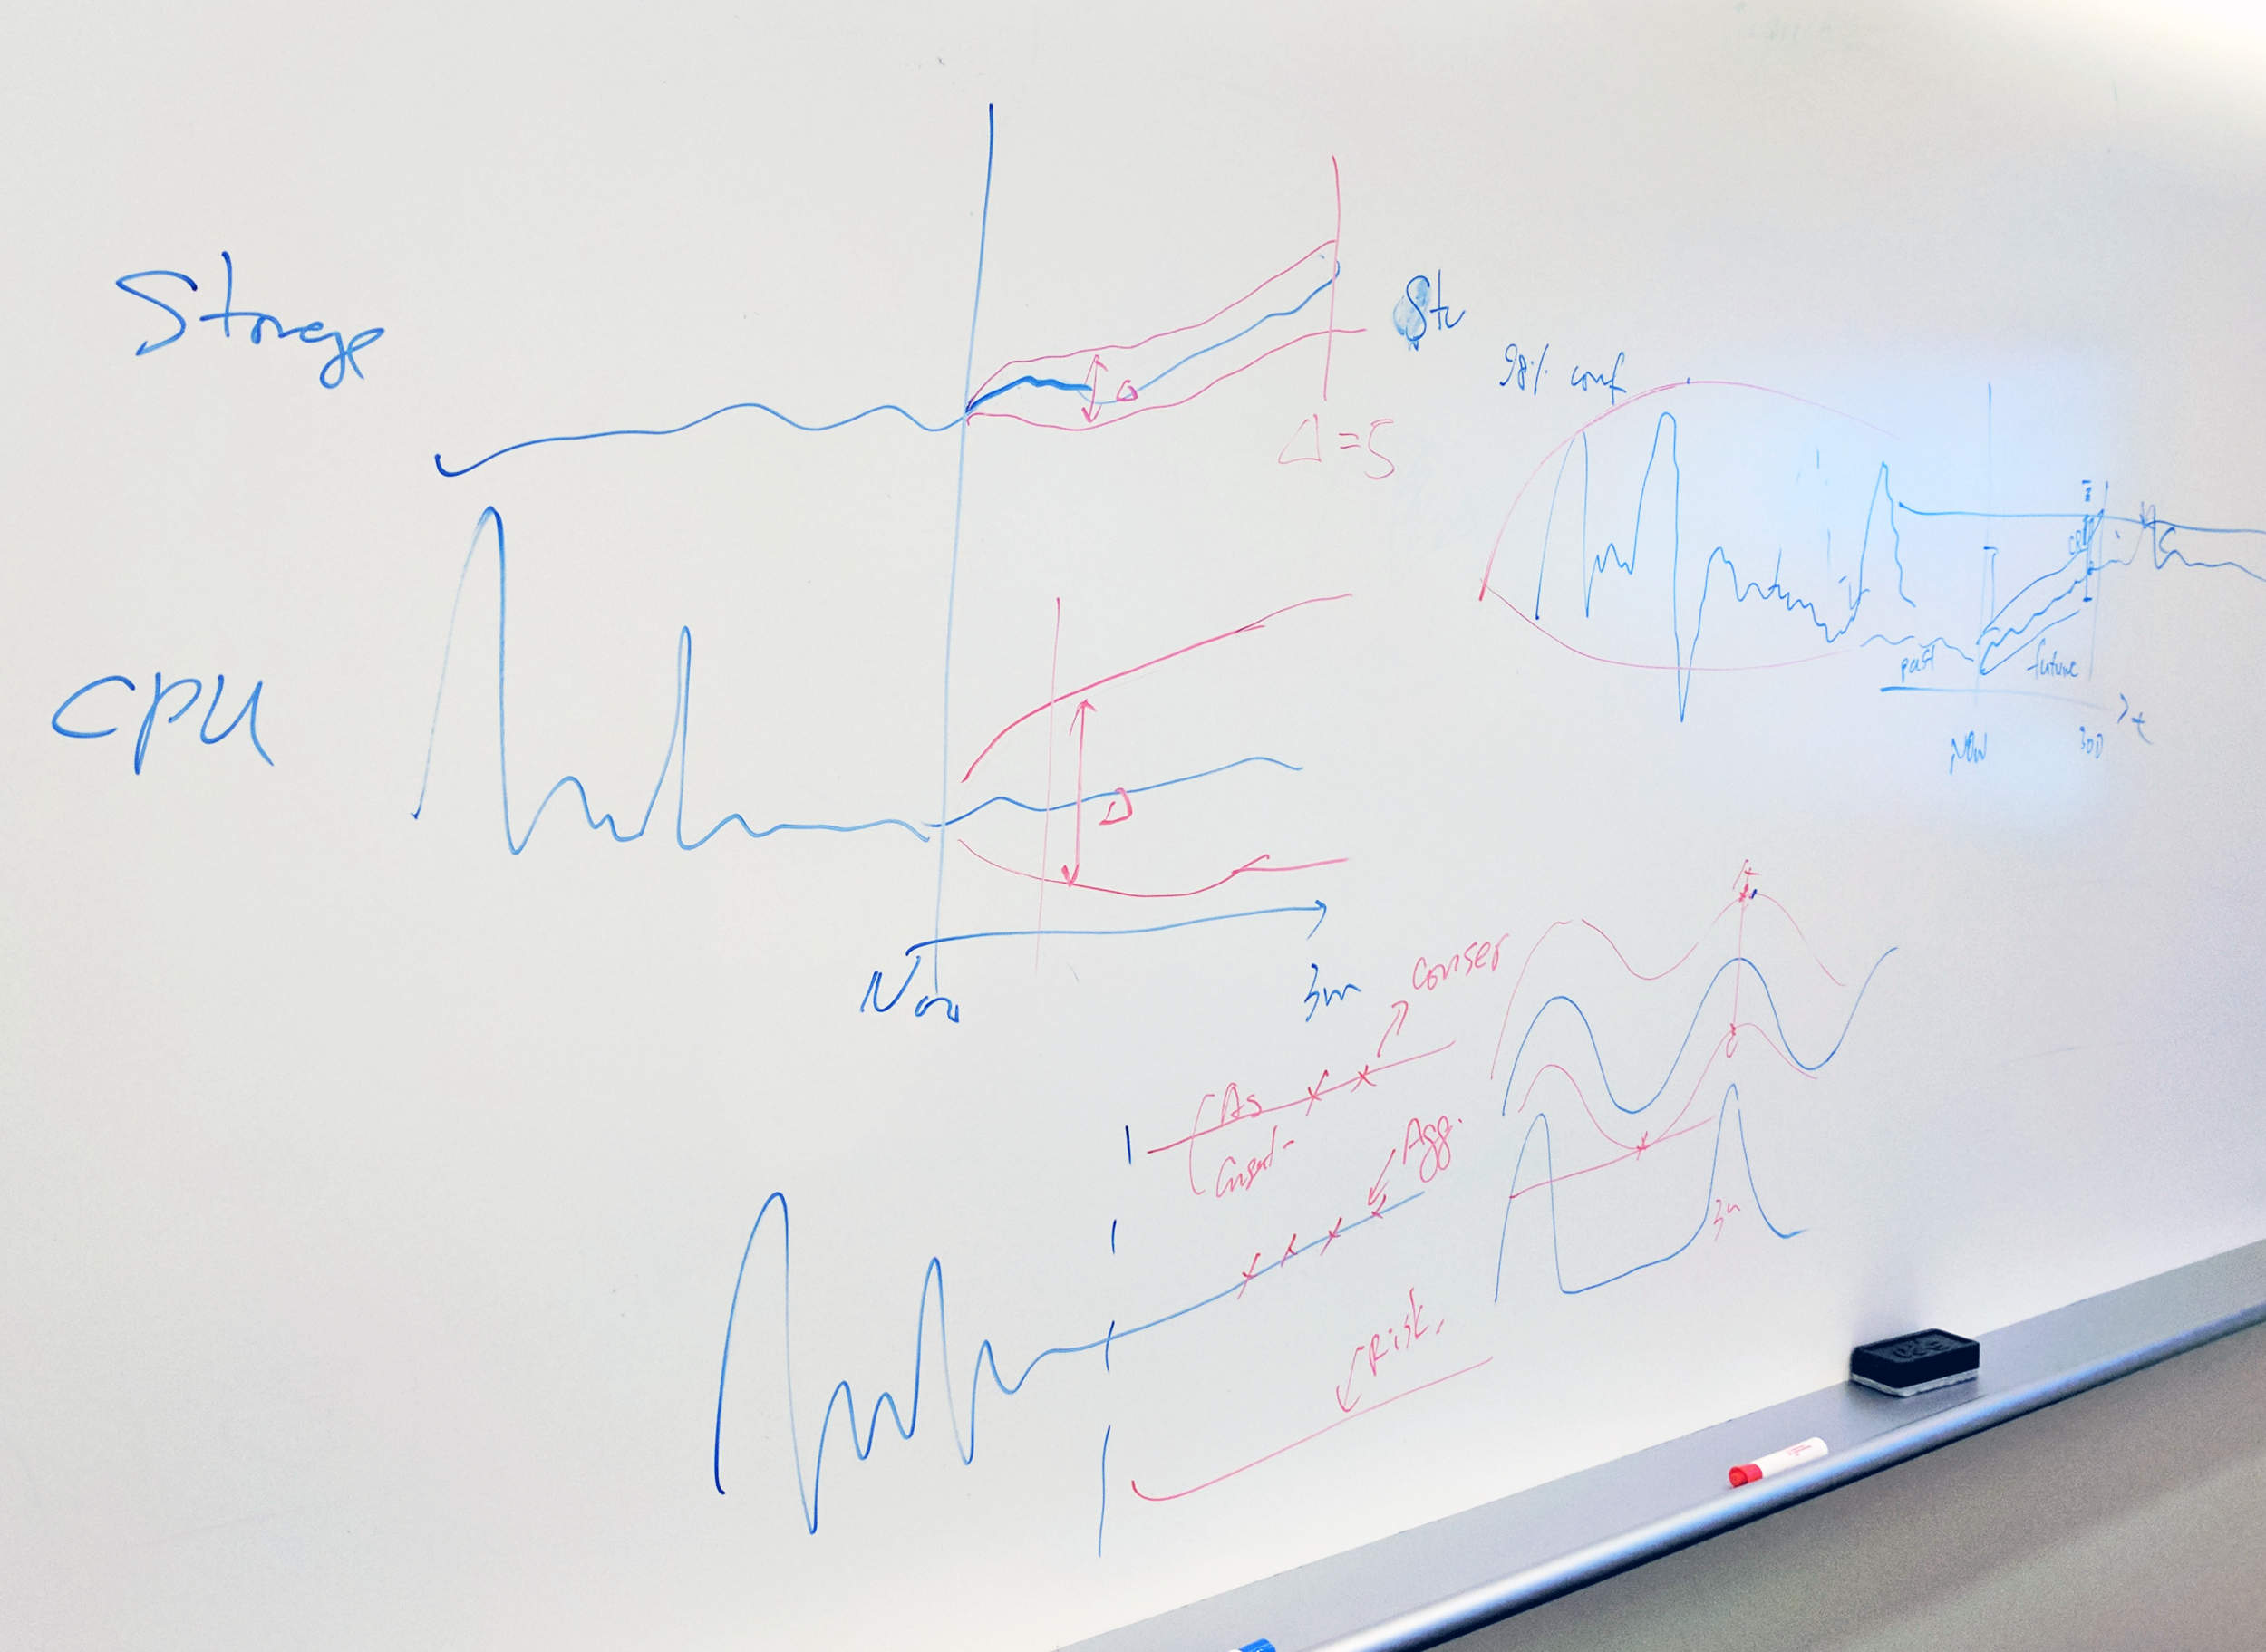
In addition to defining the flows and designs, we needed to understand how the new forecasting algorithm works. The new algorithm takes a user’s historical data and makes capacity projections into the future, allowing users to better understand when they might run out of capacity.
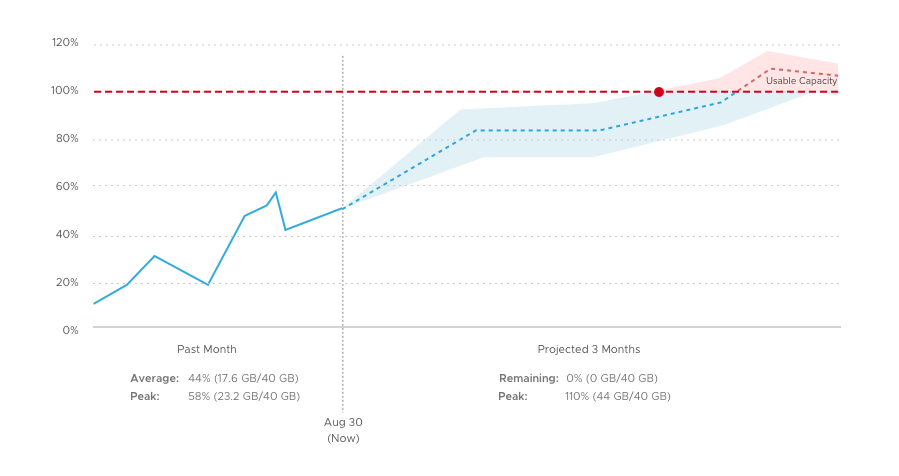
We discussed the granularity of the data, how the graph may change as the algorithm picks up more historical data over time, and the confidence interval of the prediction. All of this helped us determine how to visualize the graph and what types of graphical features a user might need to best consume the information.
An example of a discussion with the engineering team on how the capacity forecasting algorithm works.
A more high fidelity exploration of the forecasting visualization
PROTOTYPES AND STORYBOARDS
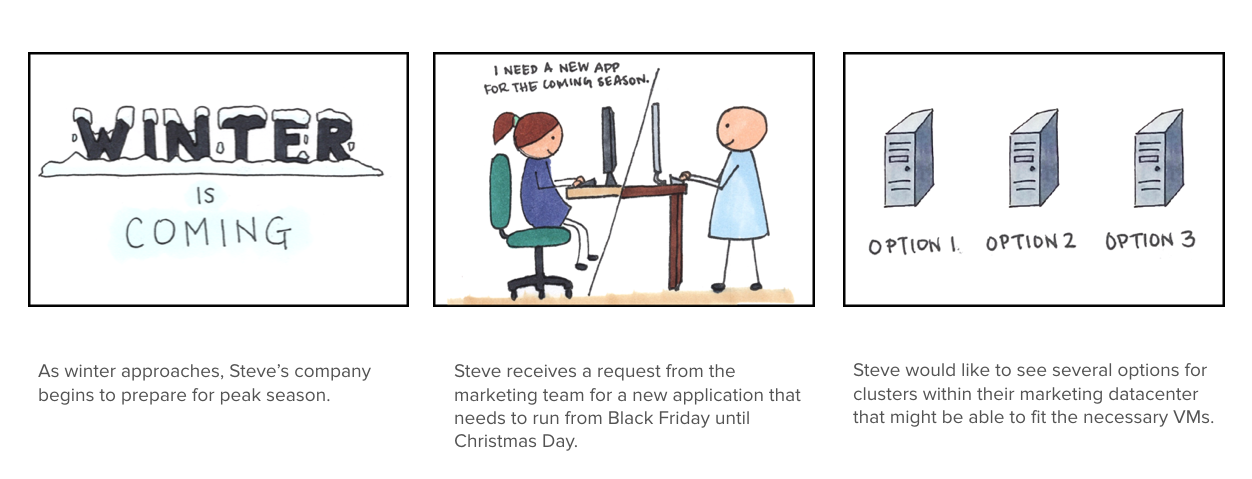
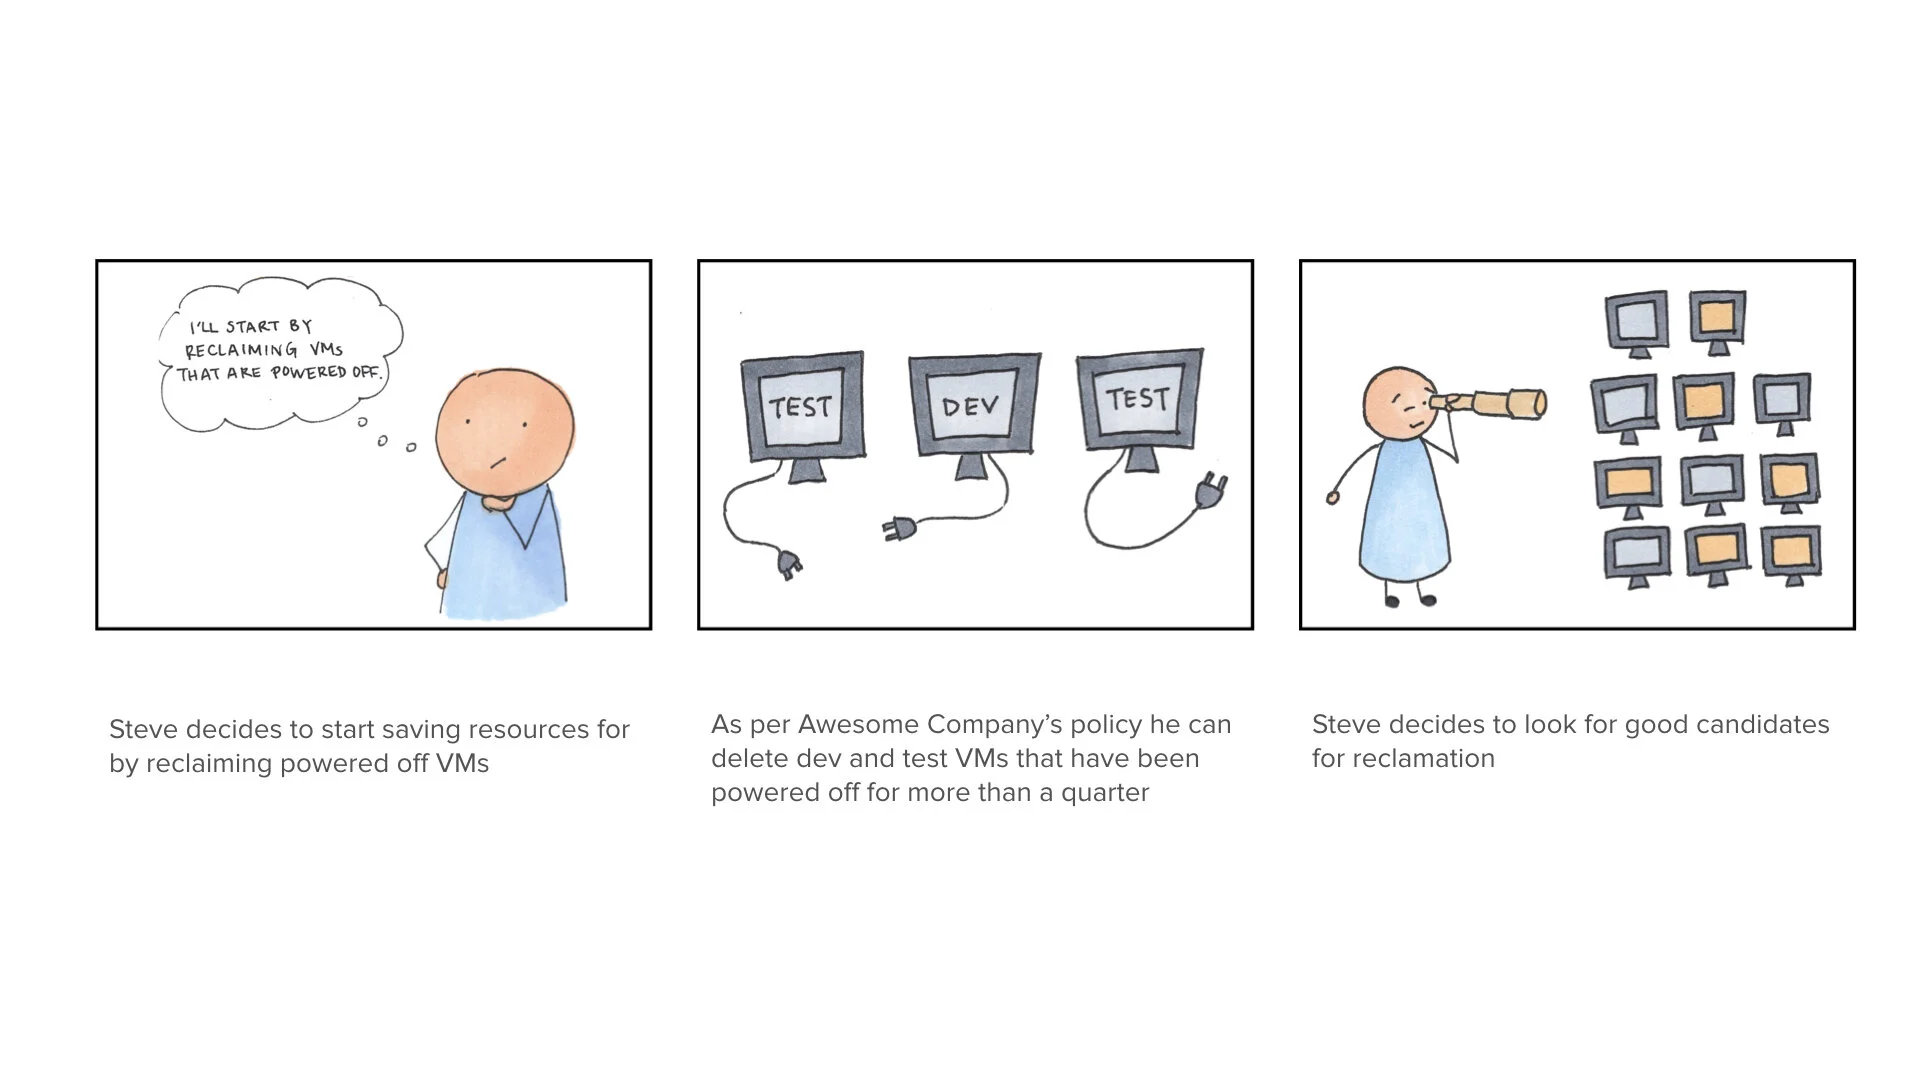
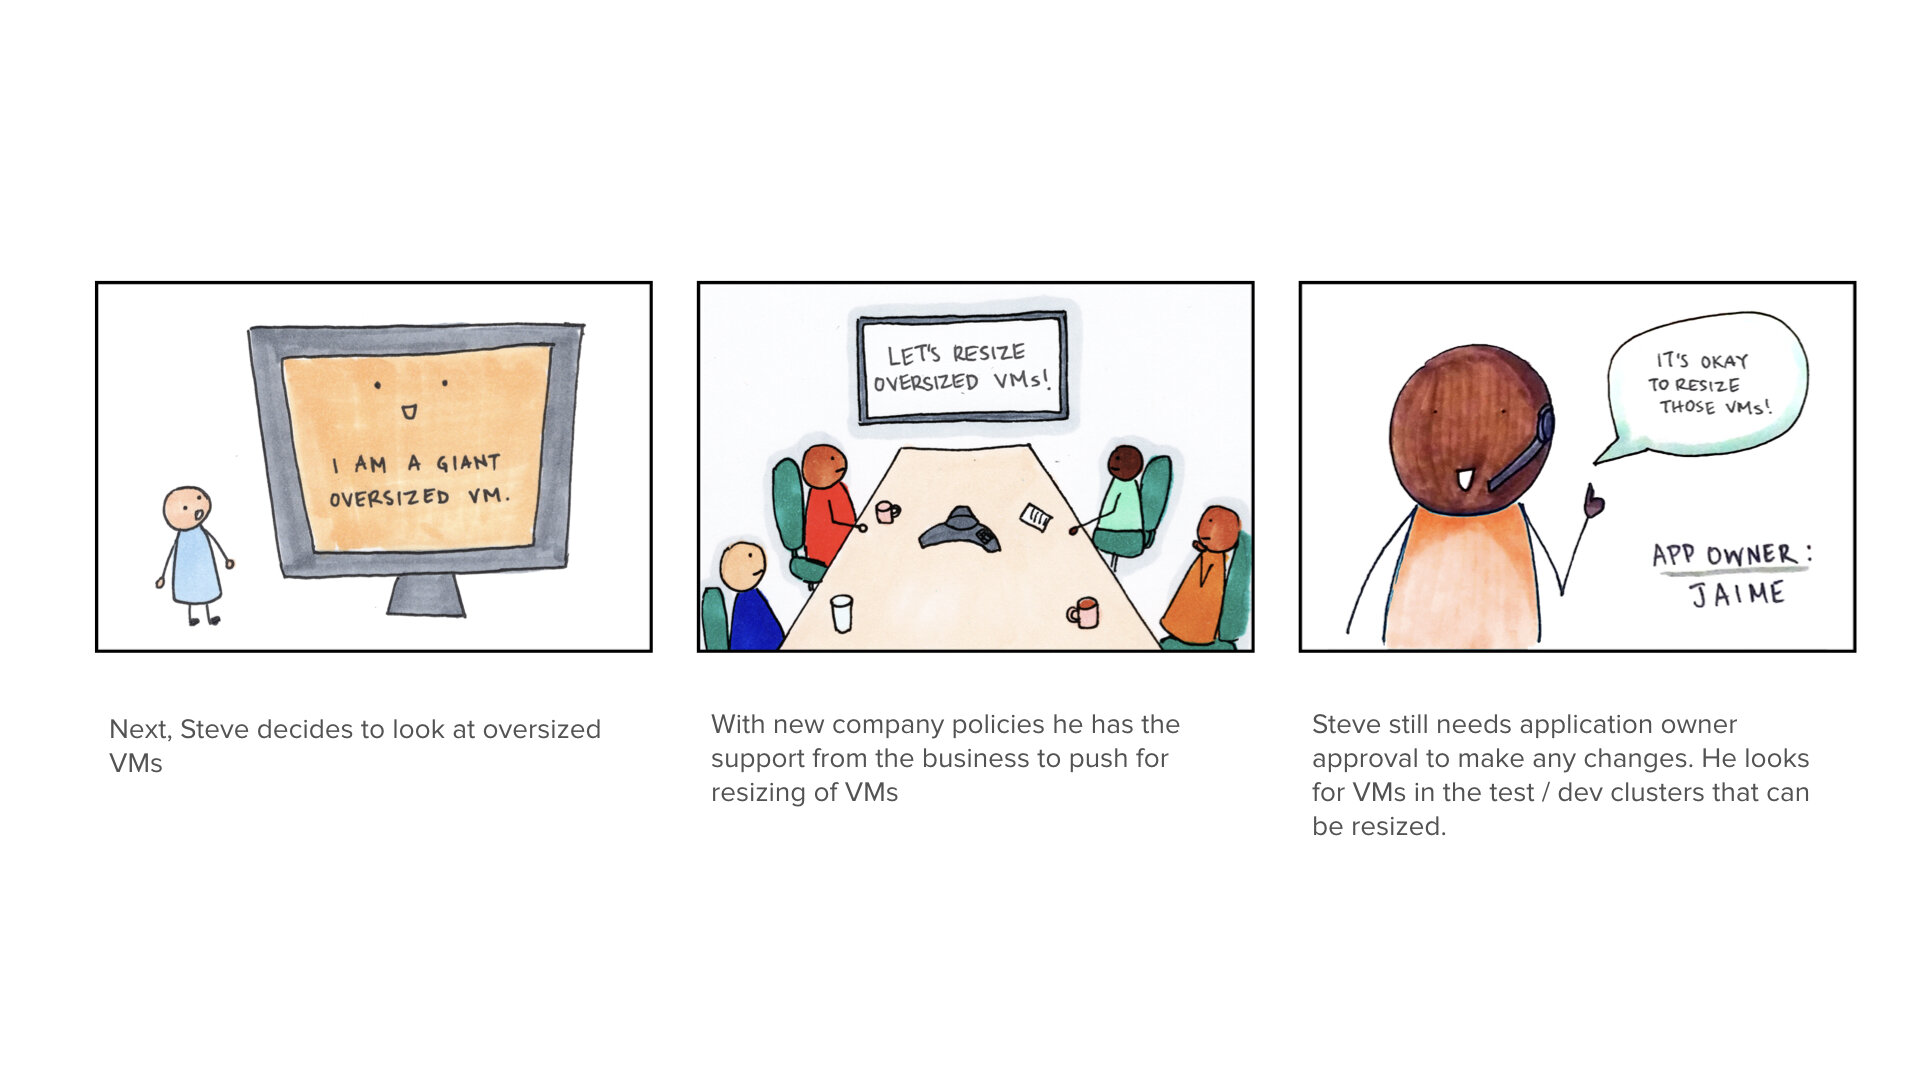
As part of my design process, I always storyboard out the scenarios. It’s important to capture the problem we’re solving, the user who’s encountering this problem, the trigger points for which the user will come to use our product, and the user’s expected results after using our product. The storyboards you see throughout this project were hand drawn by me.
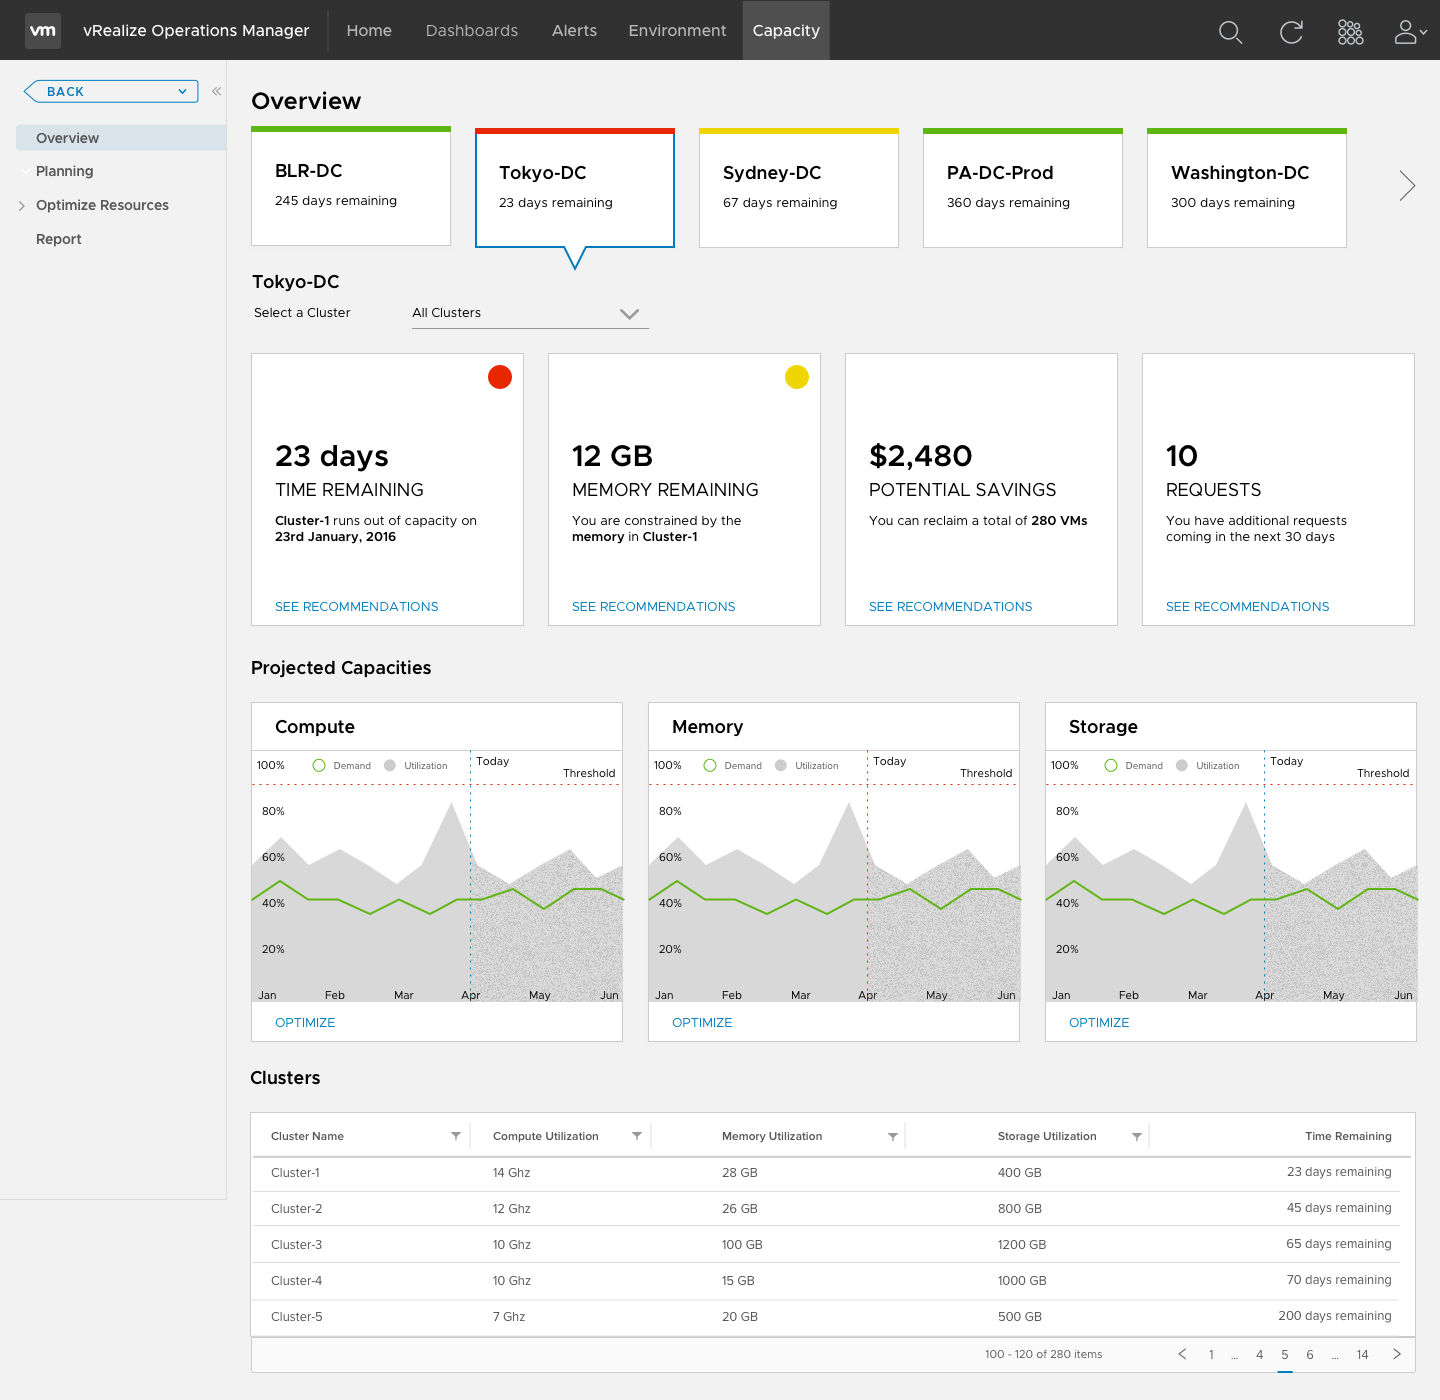
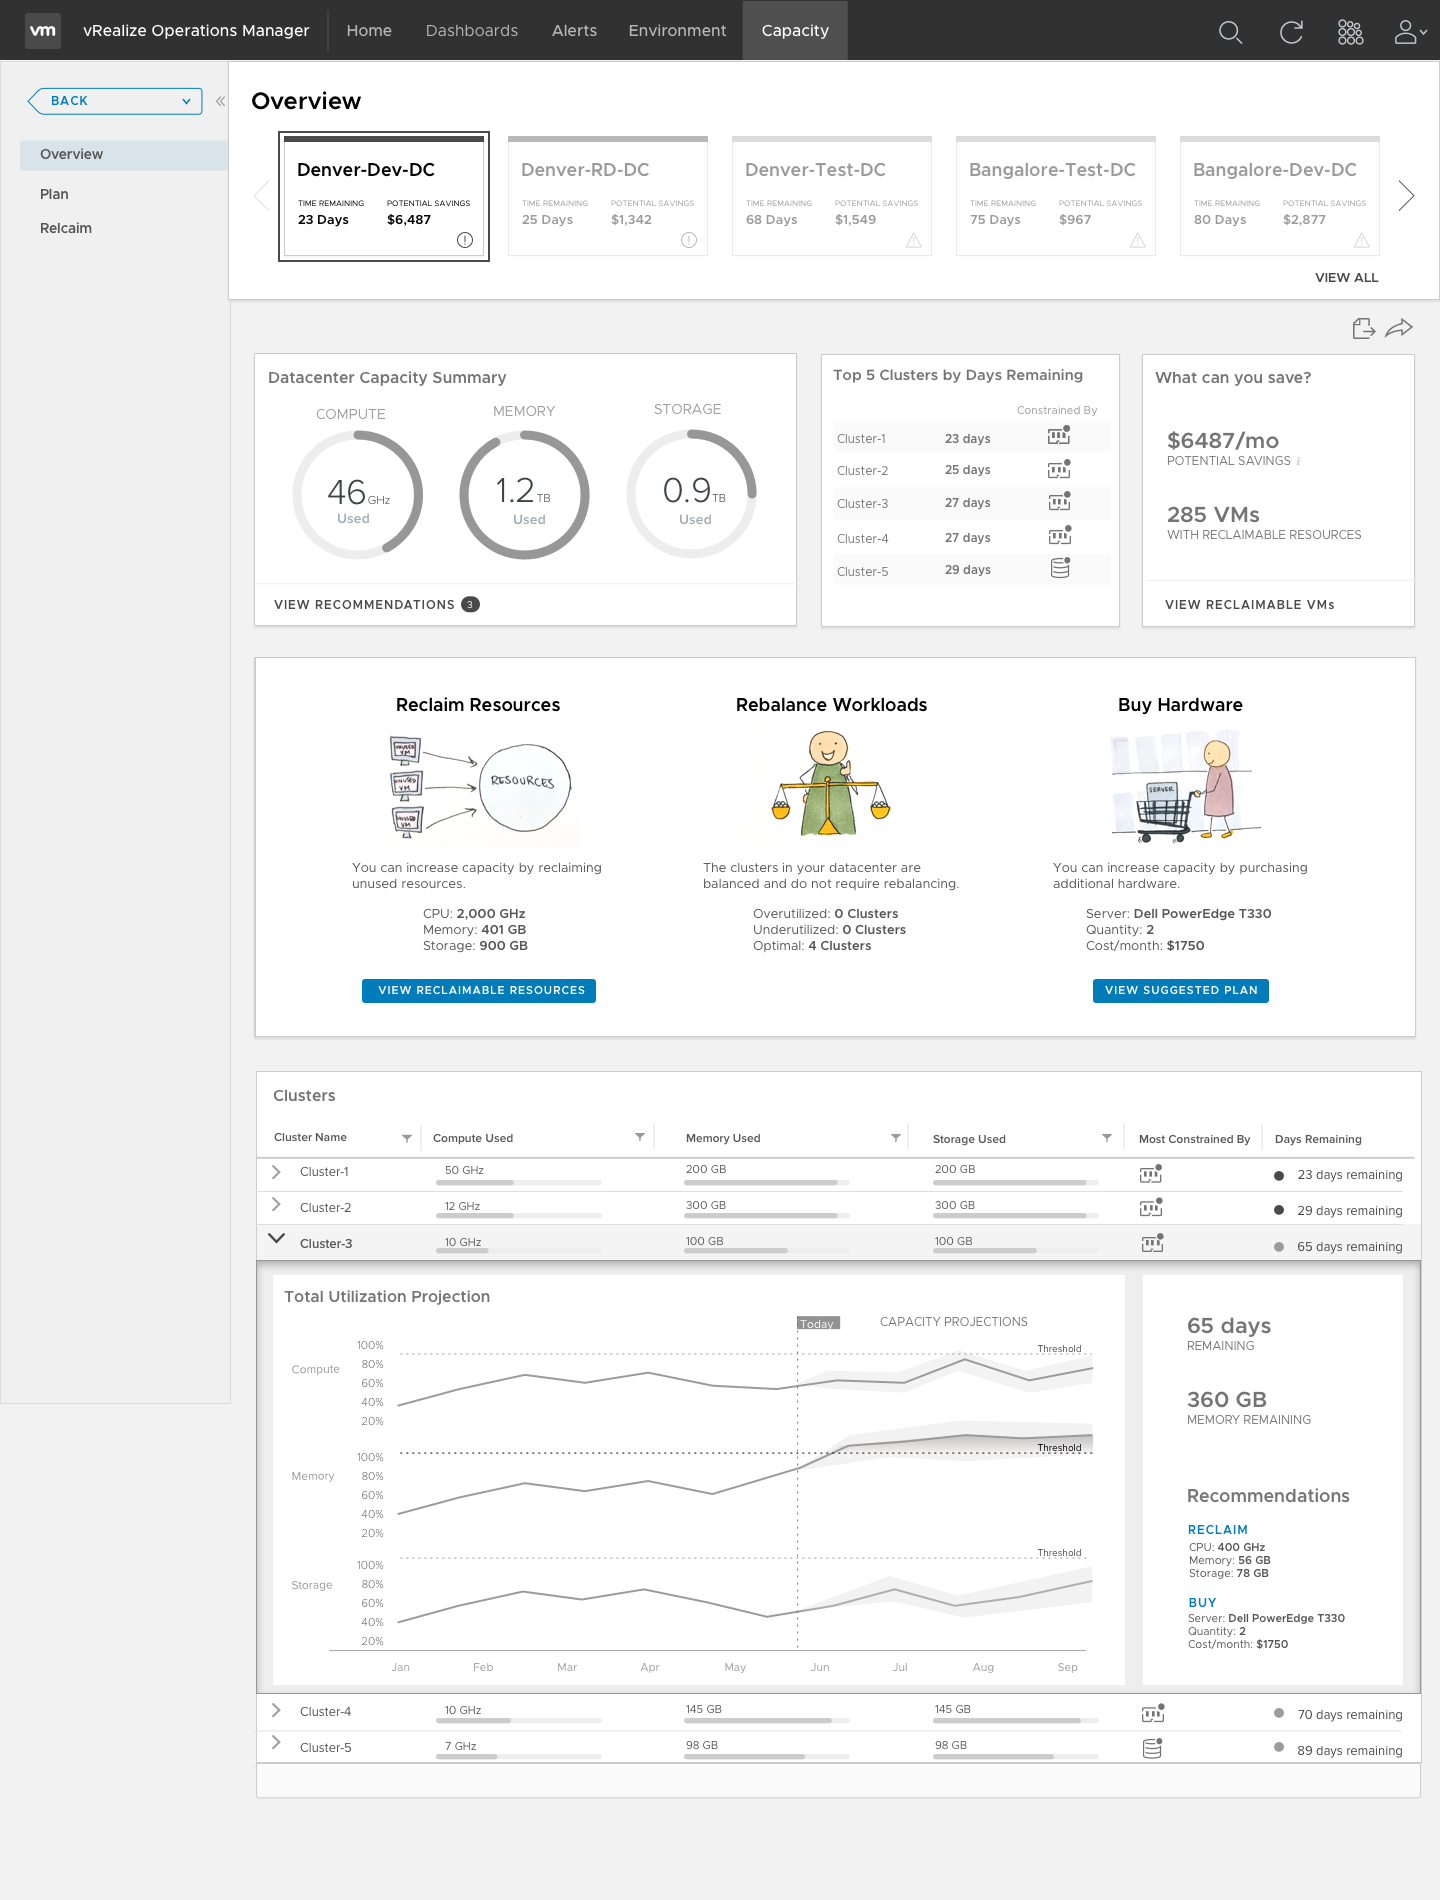
Taking everything we produced from the design sprints, we began iterating. We created realistic user scenarios based on our prior research and created hi-fidelity prototypes with realistic capacity data included to help users and stakeholders understand the solution.
Throughout the process, we had rolling user studies and were constantly collecting feedback on the designs. We wanted to make sure our designs are actually solving the users’ problems. The iterations we made were based on both user and stakeholder input.
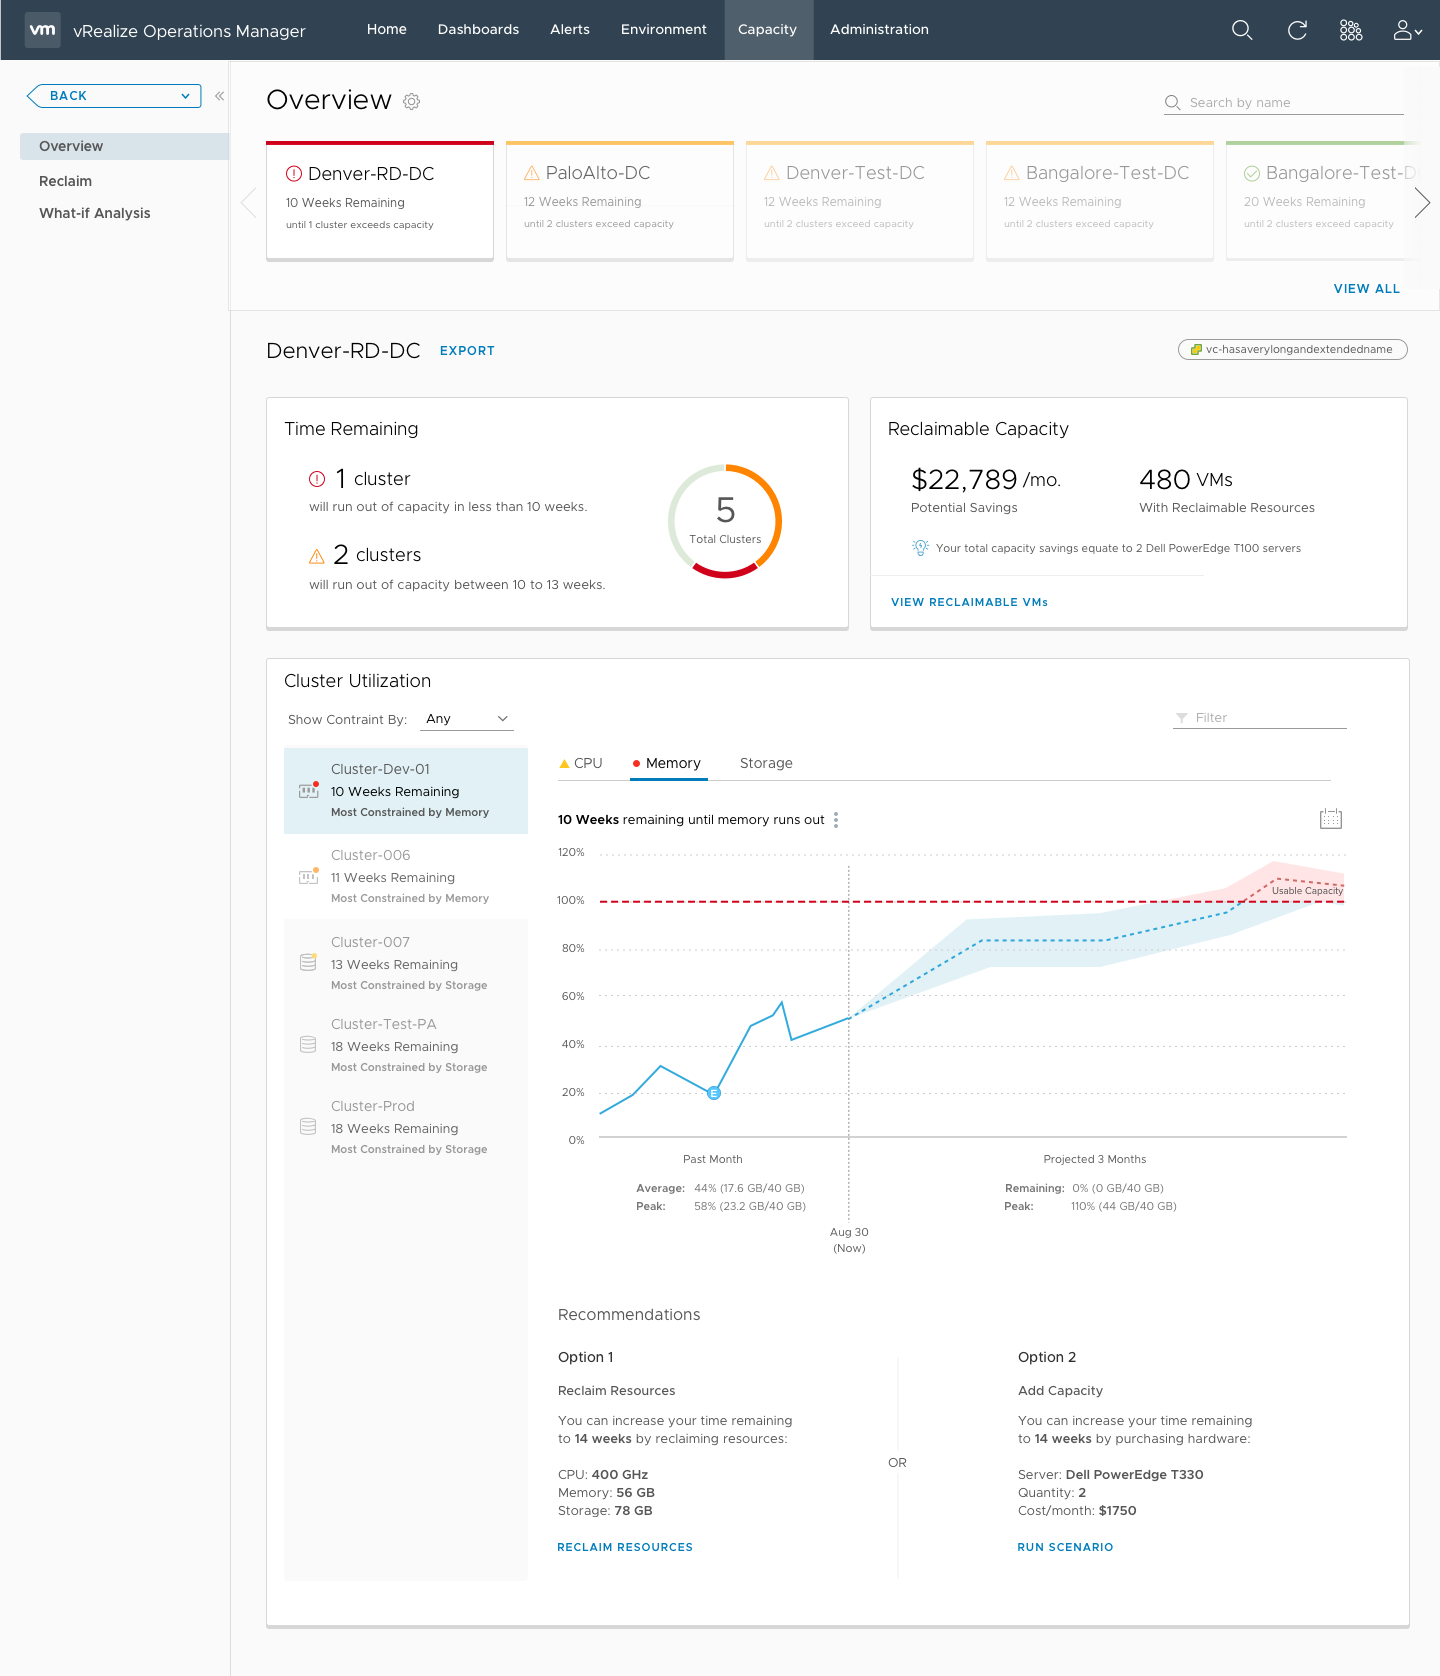
Capacity Overview
We simplified the overview after realizing a lot of information was extraneous to the users. As we gained better understanding of the algorithm, we also updated the projection visualization. The final visual and interaction design for this flow was done by me.
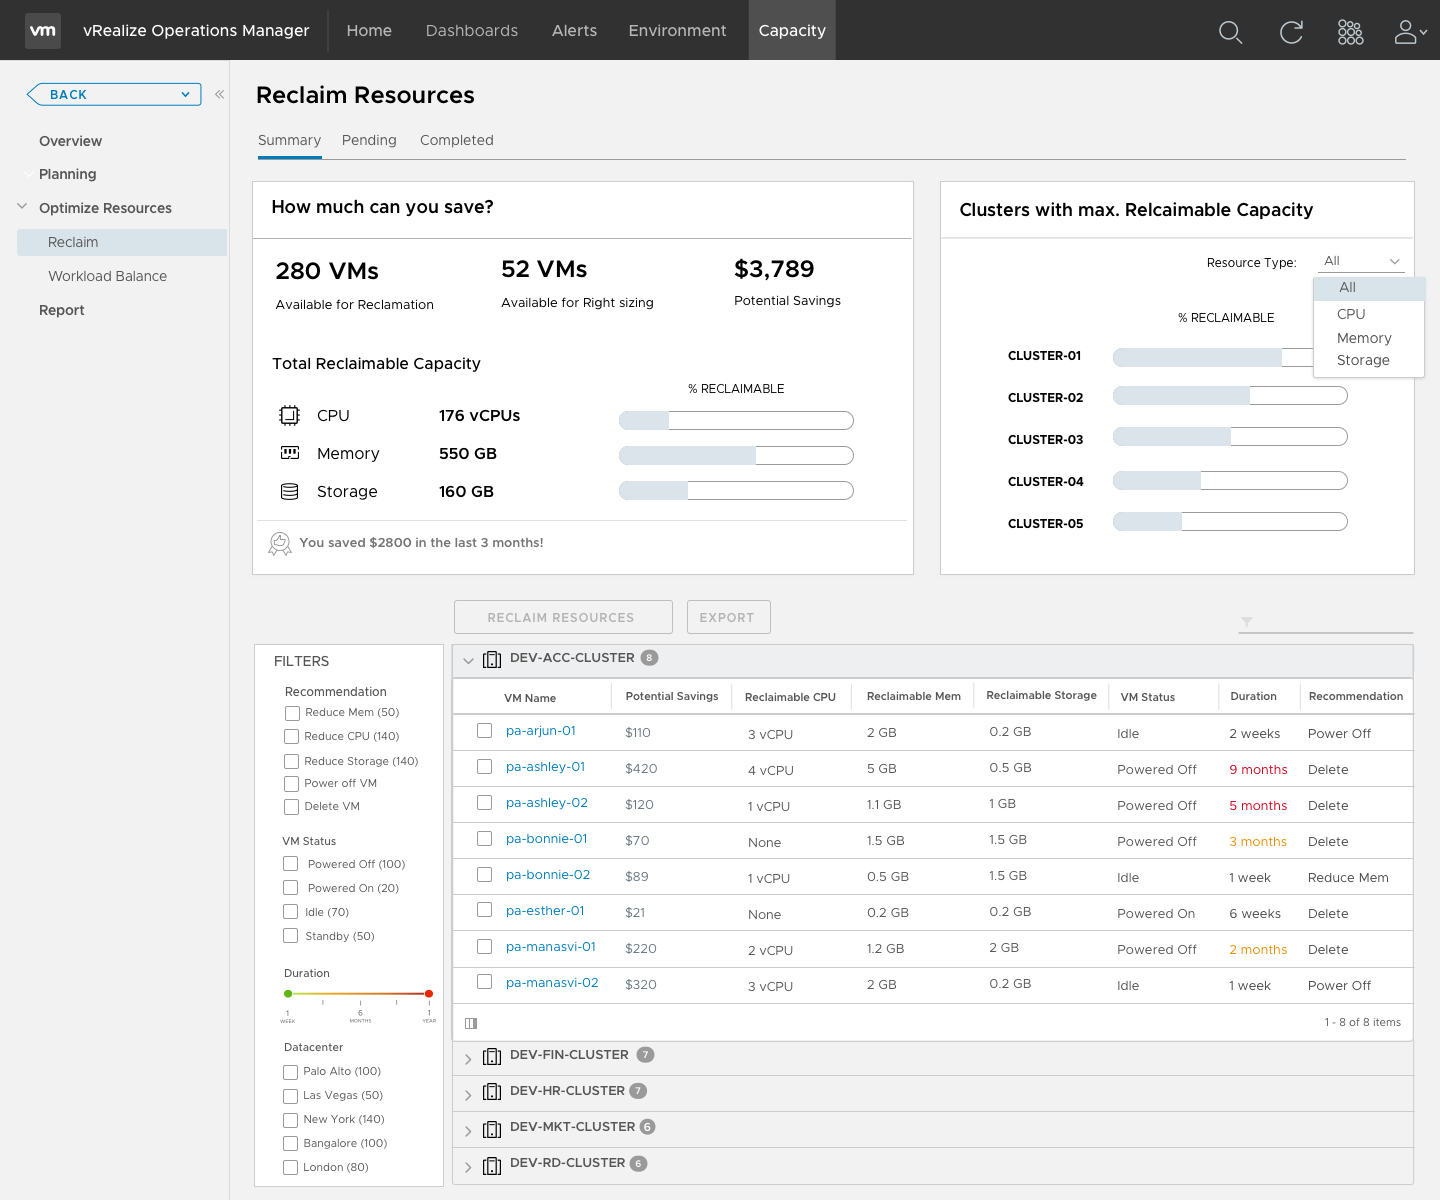
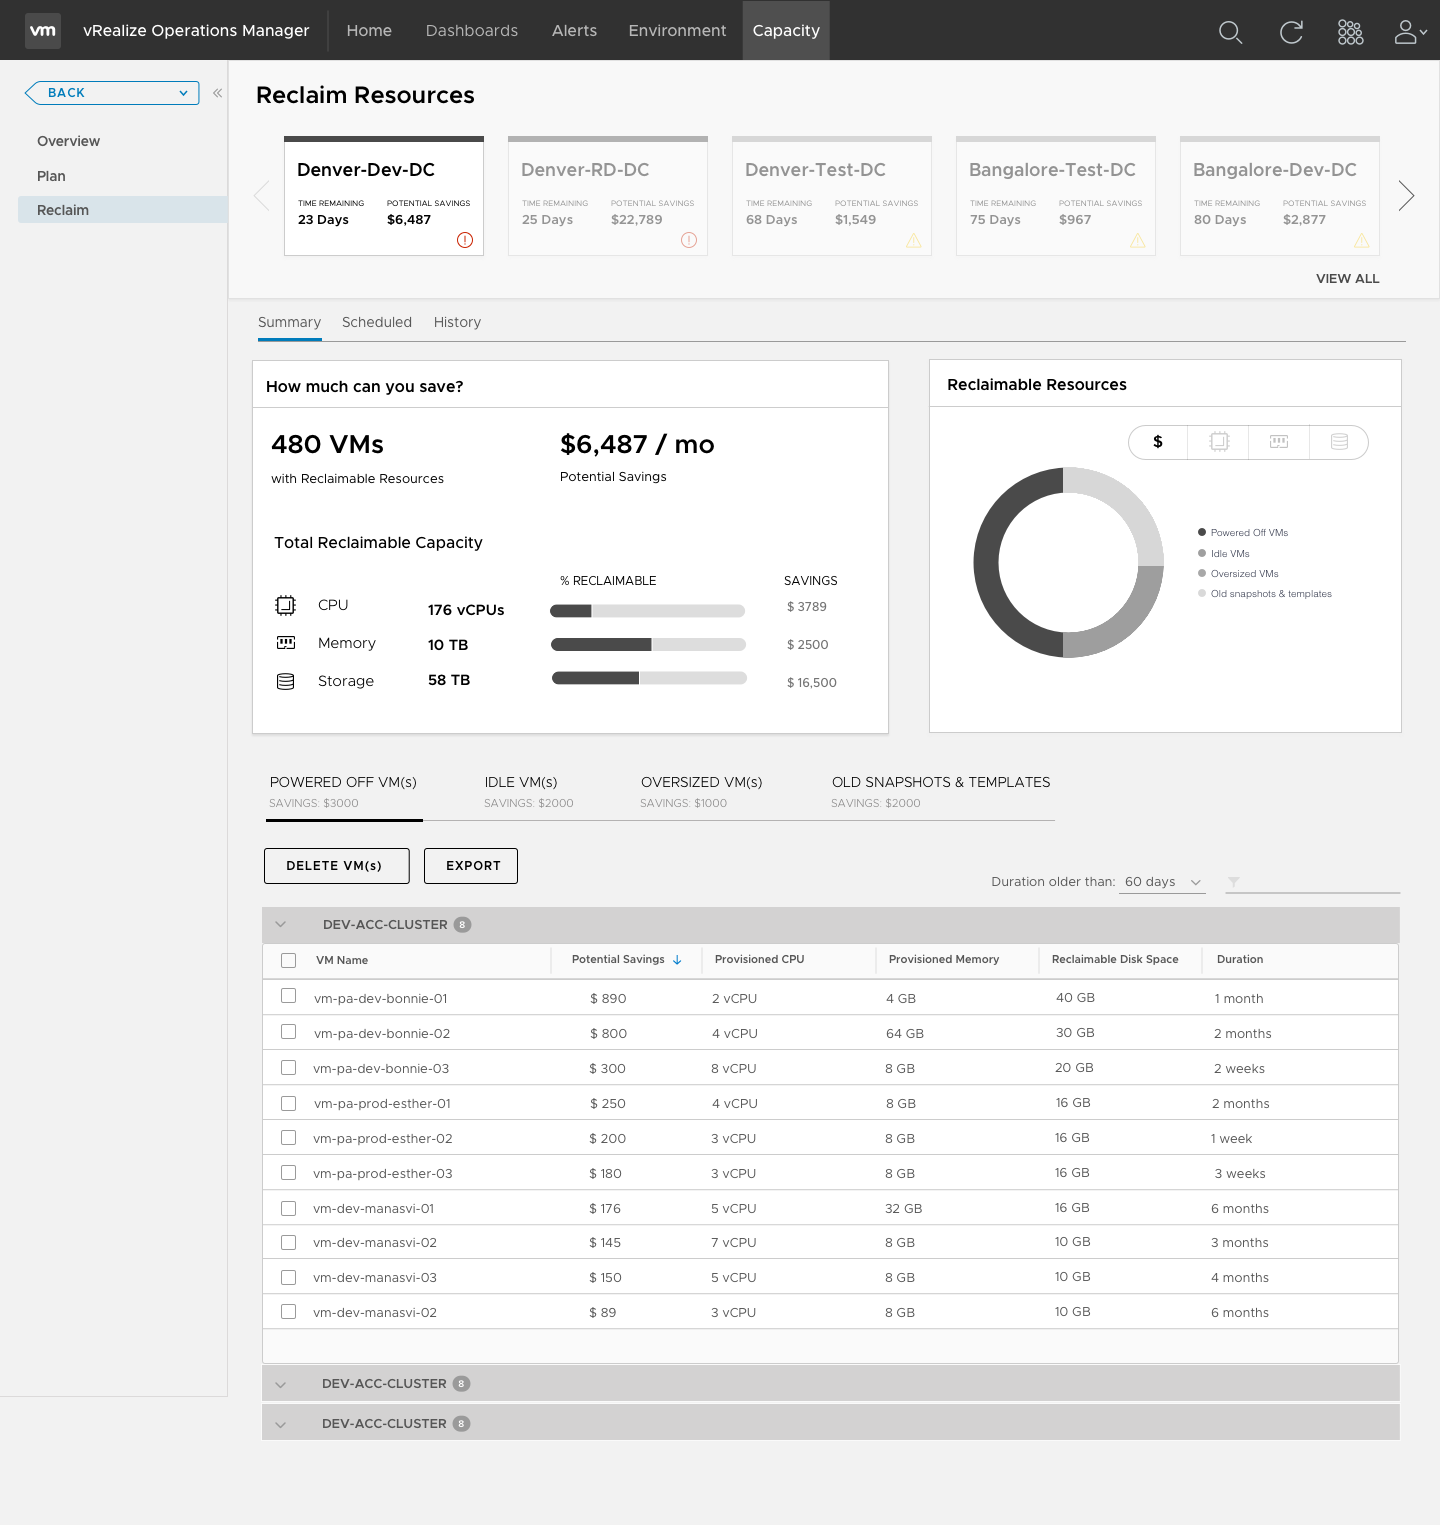
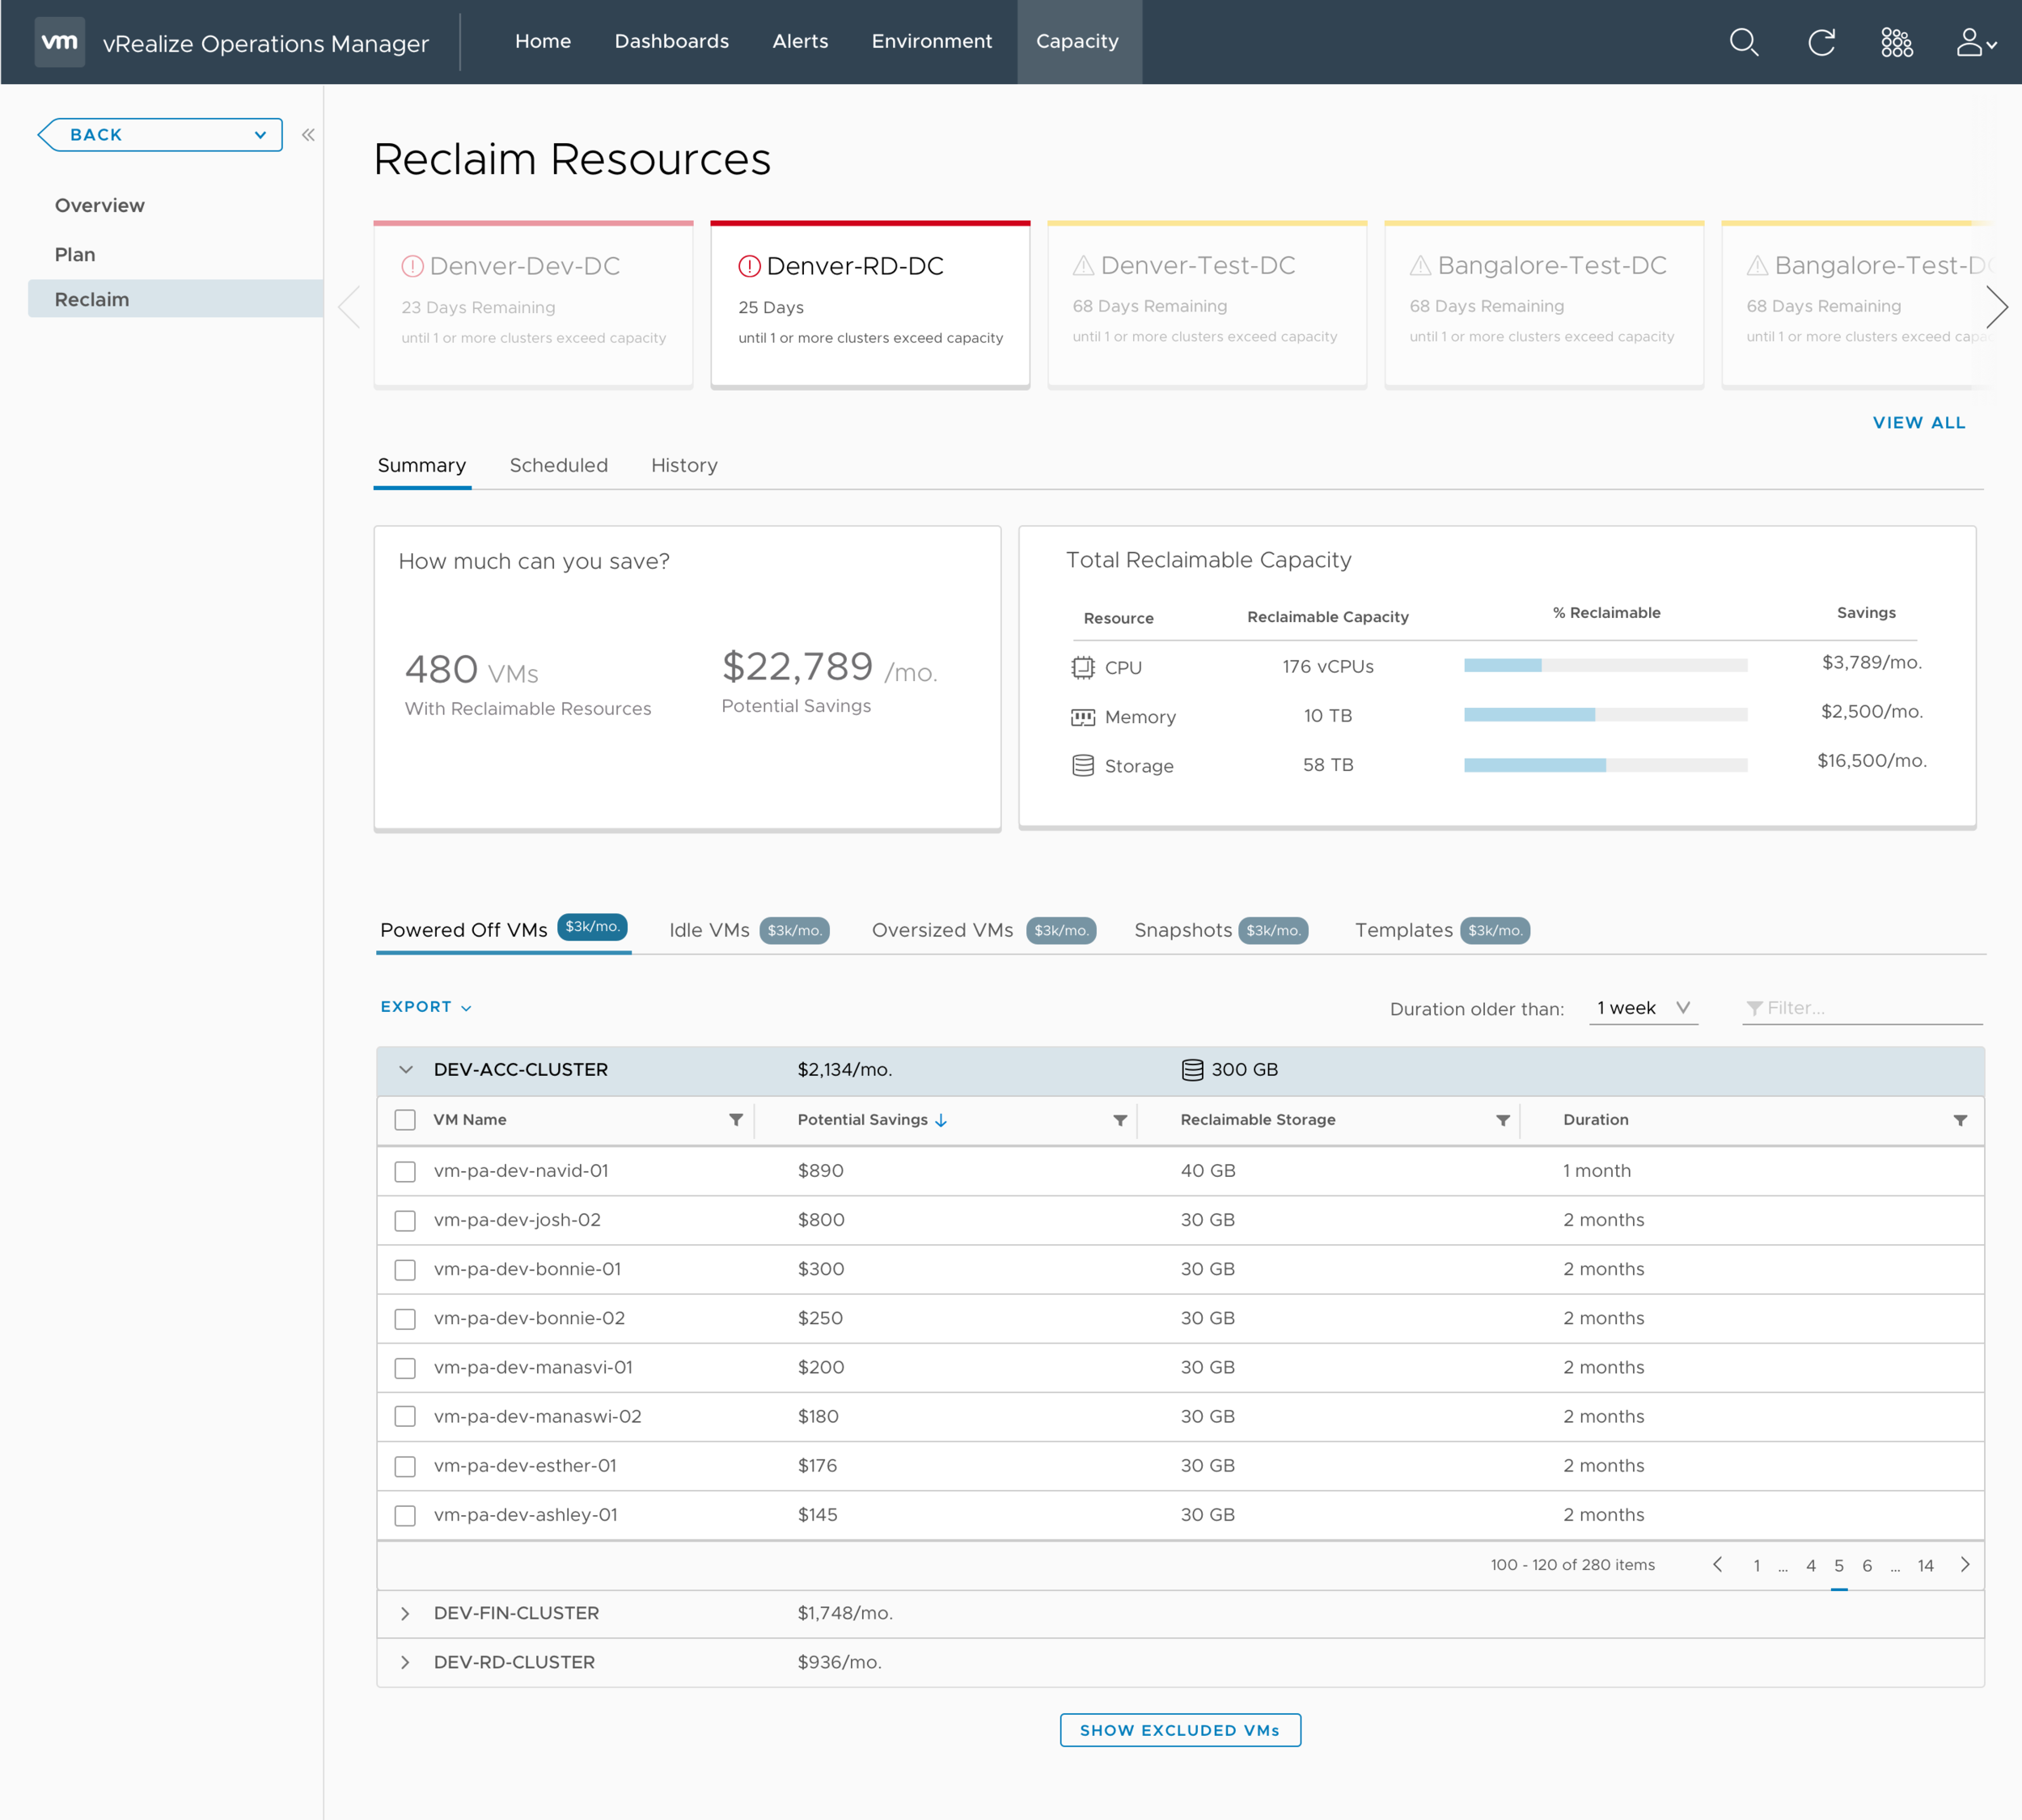
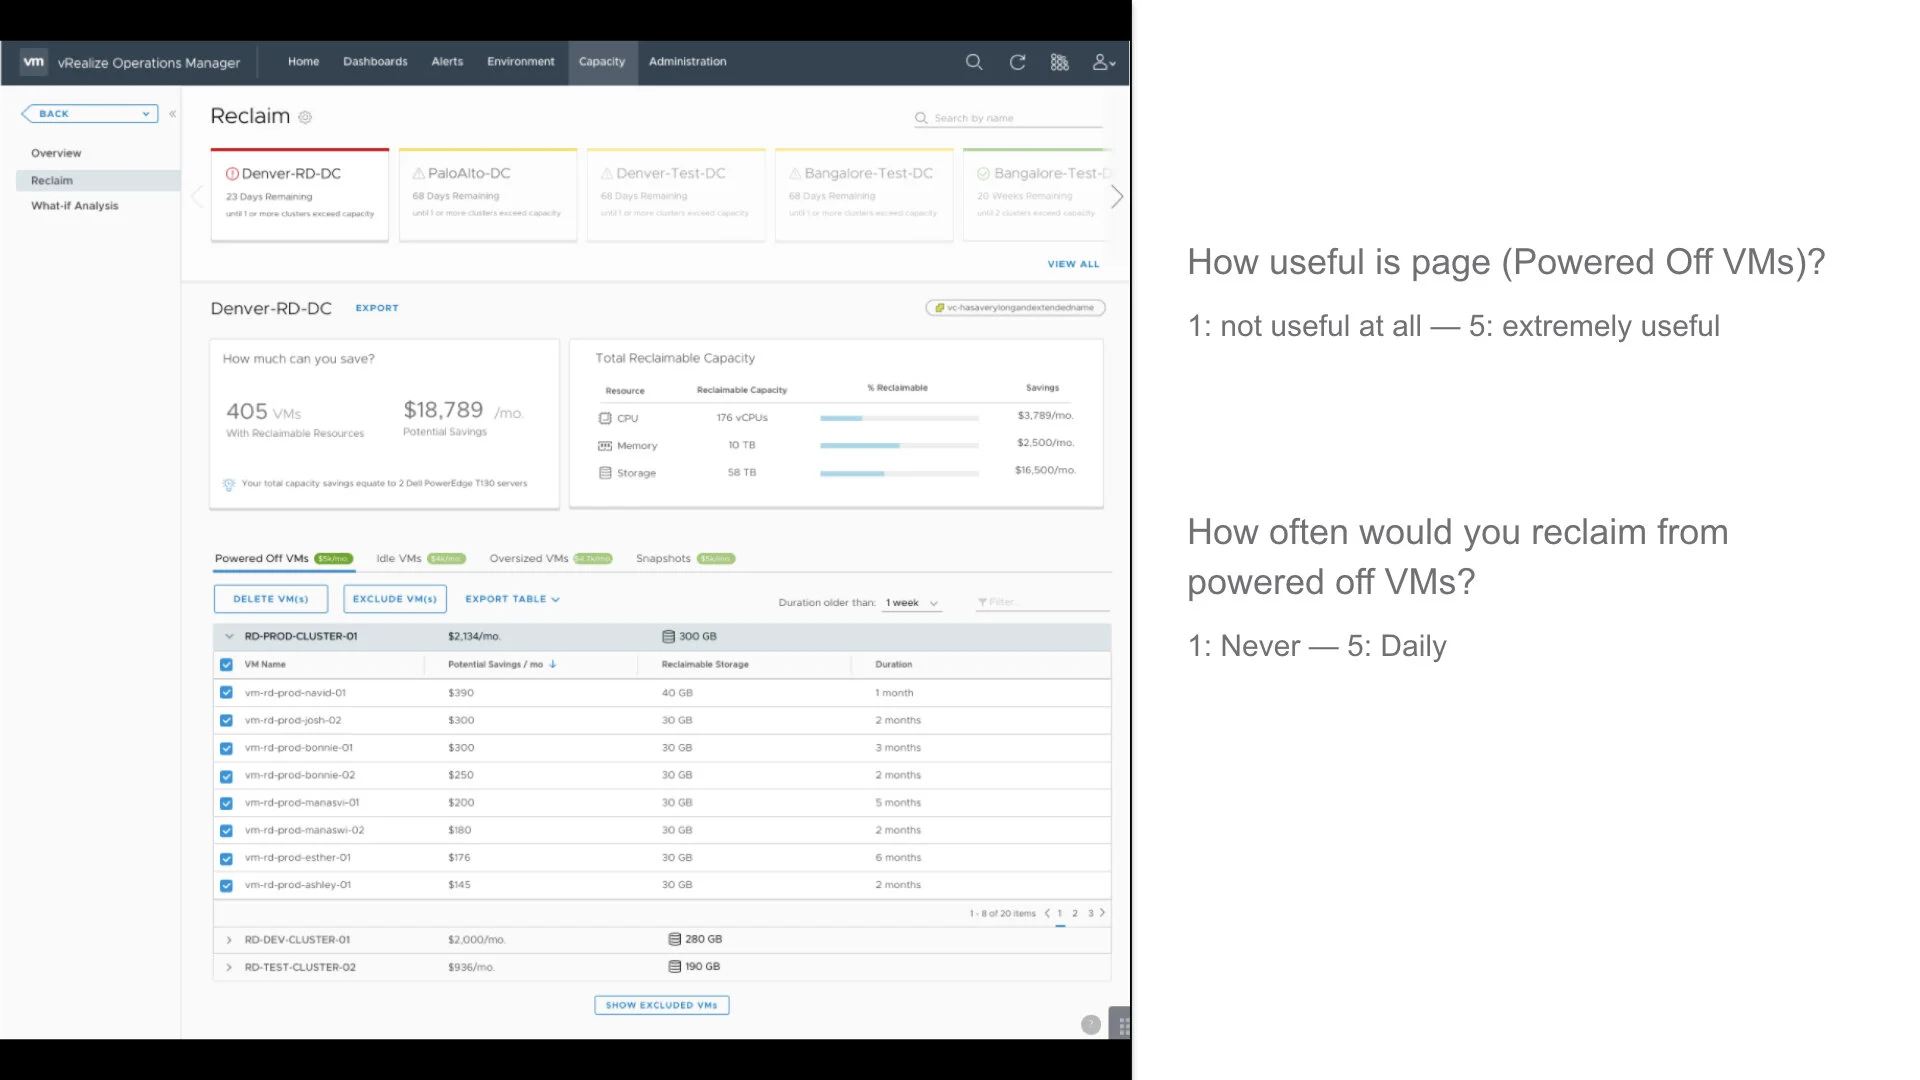
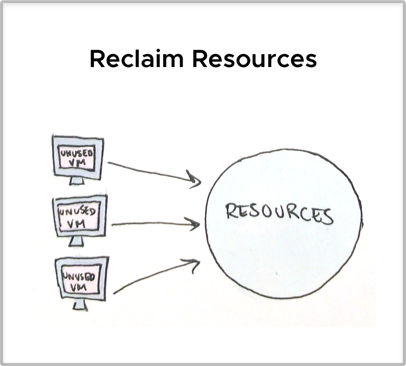
Reclaiming Resources
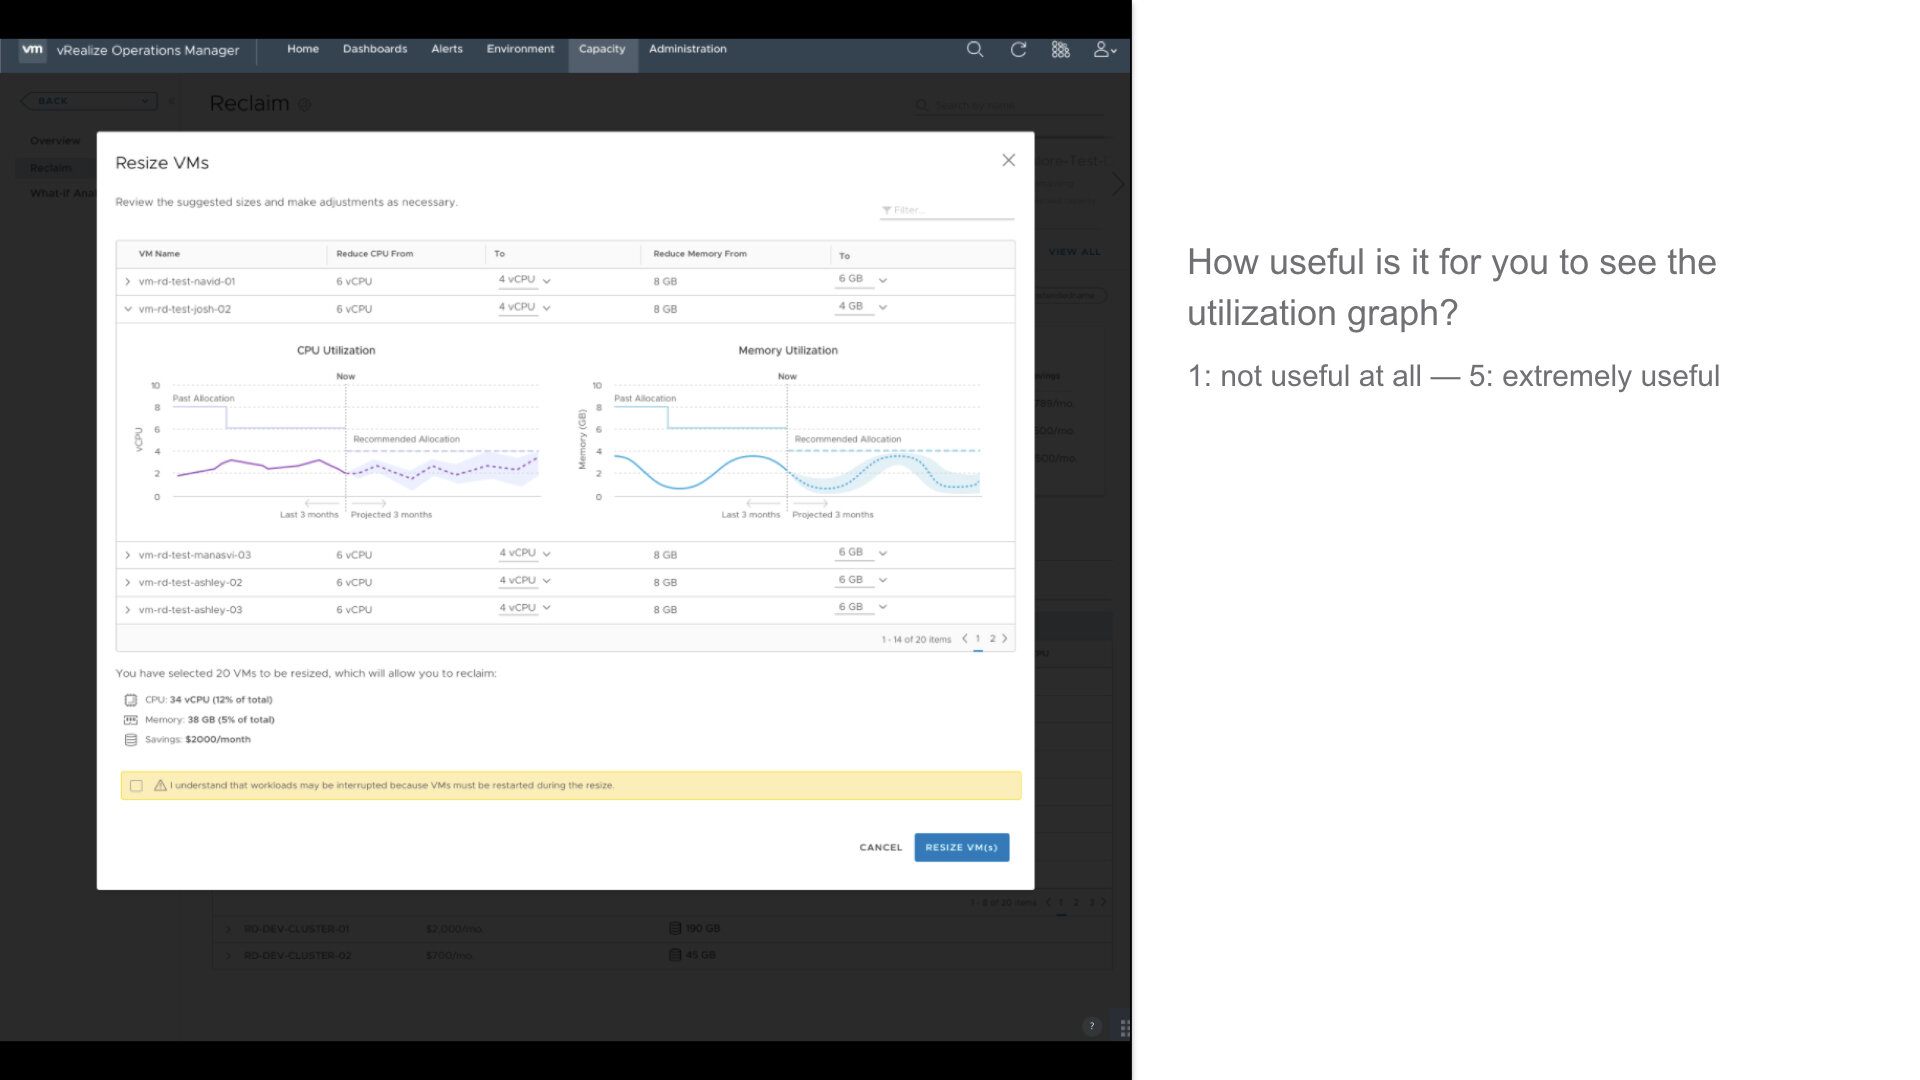
Our initial approach provided the users with a lot of filter options and very detailed summary information. However, we found that users all had a common mental model already, wanting to see the resources by type of reclamation (powered off VMs, idle VMs, oversized VMs, etc). For this flow, I contributed to the early ideas and the final interactions.
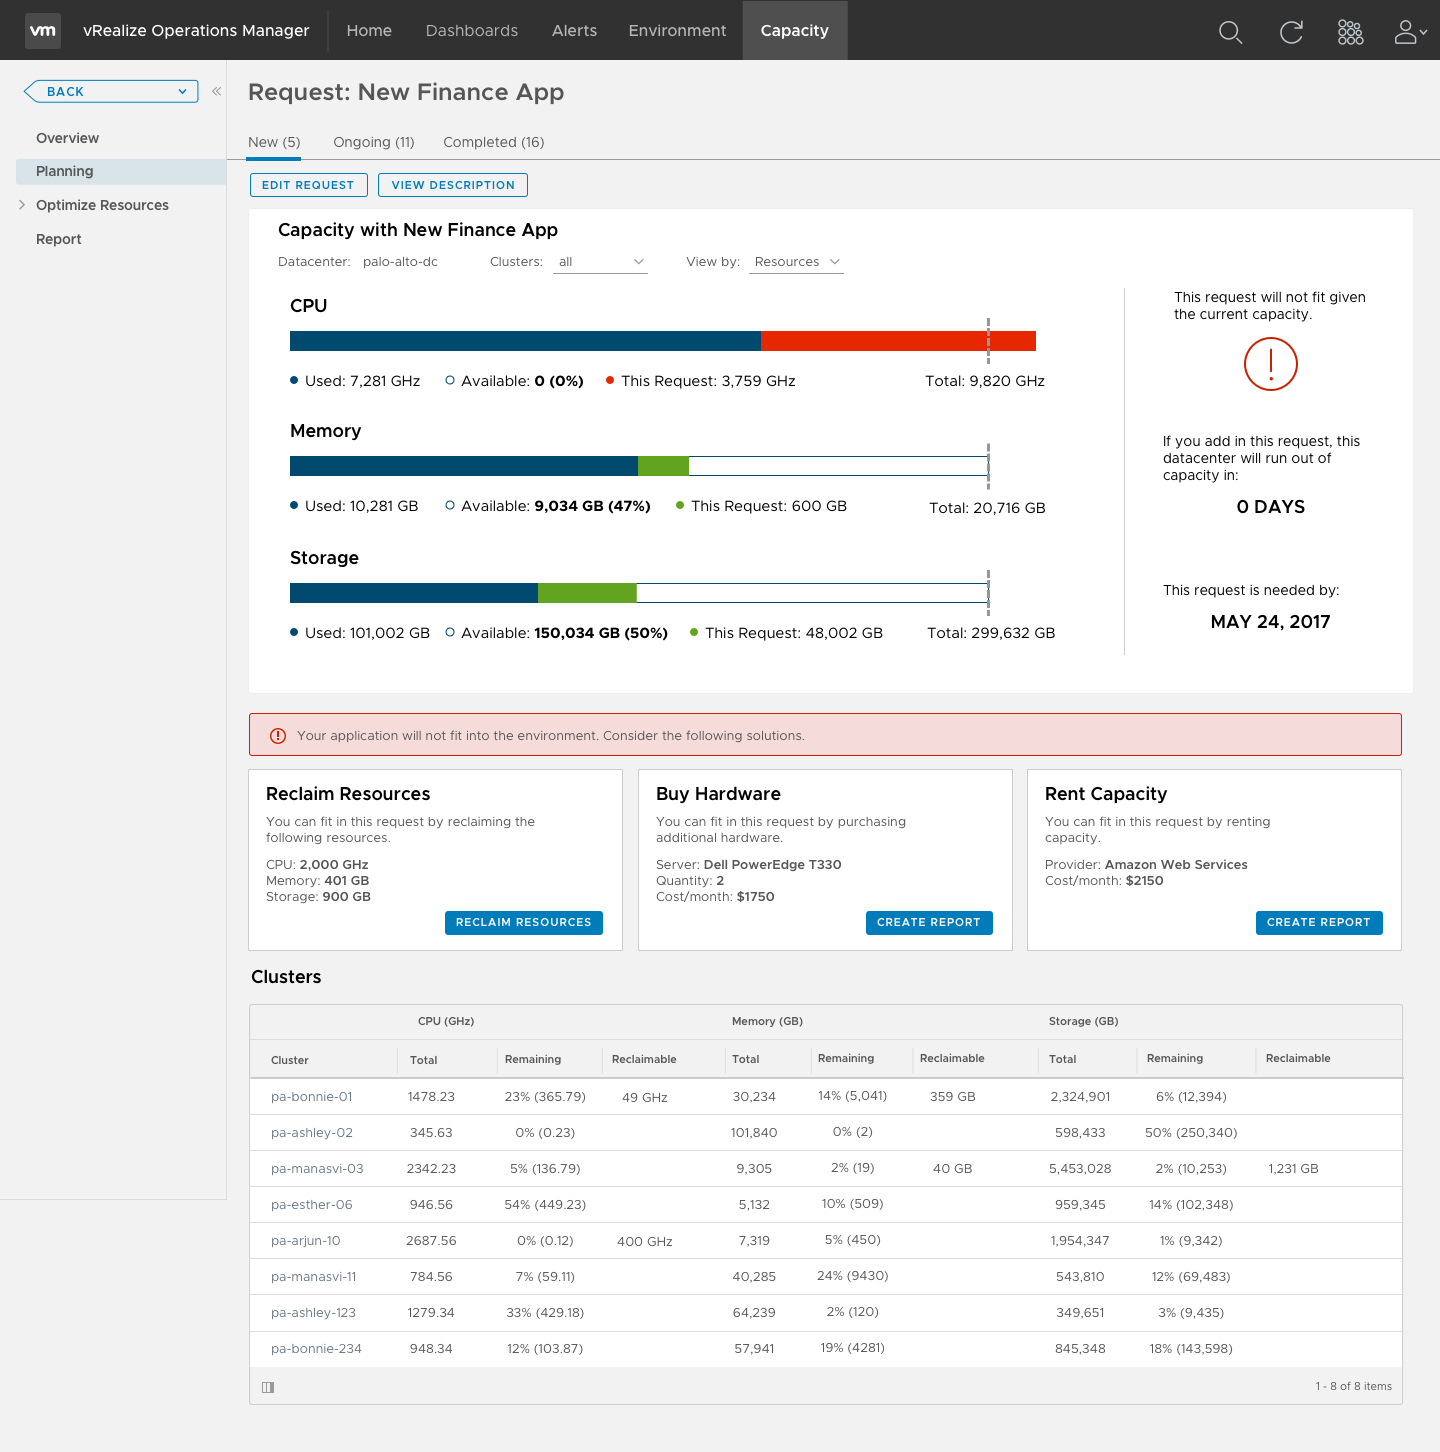
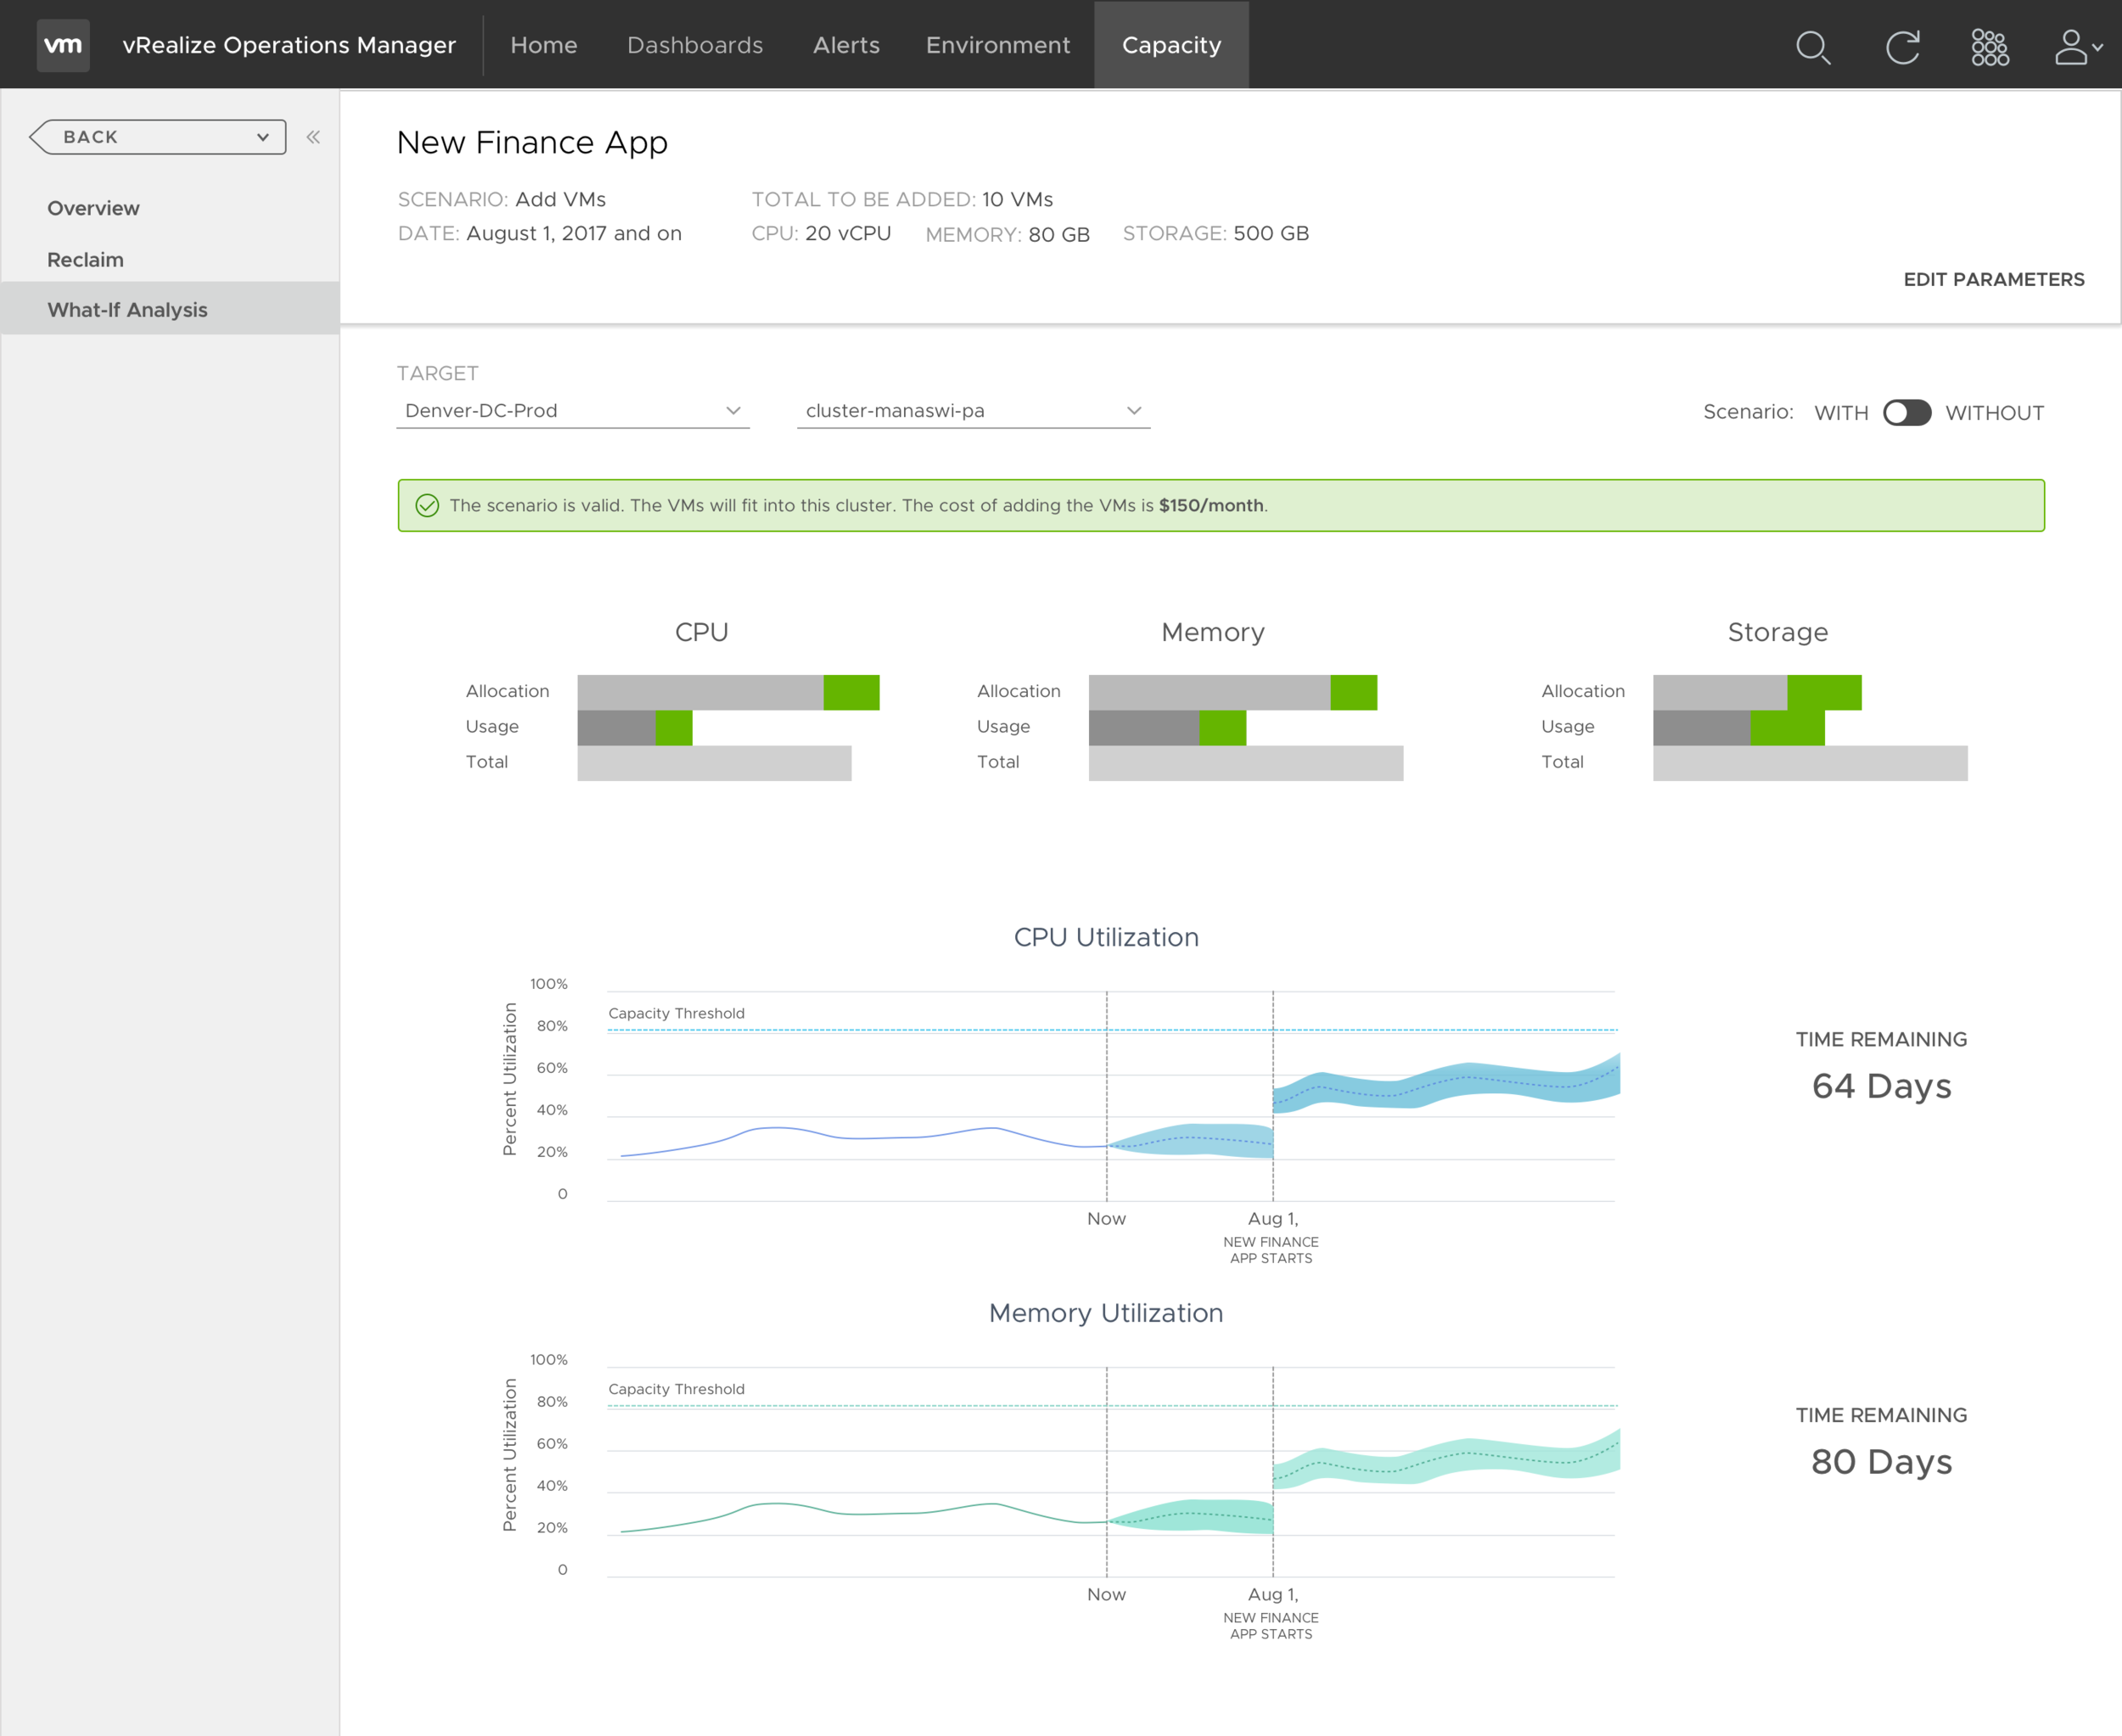
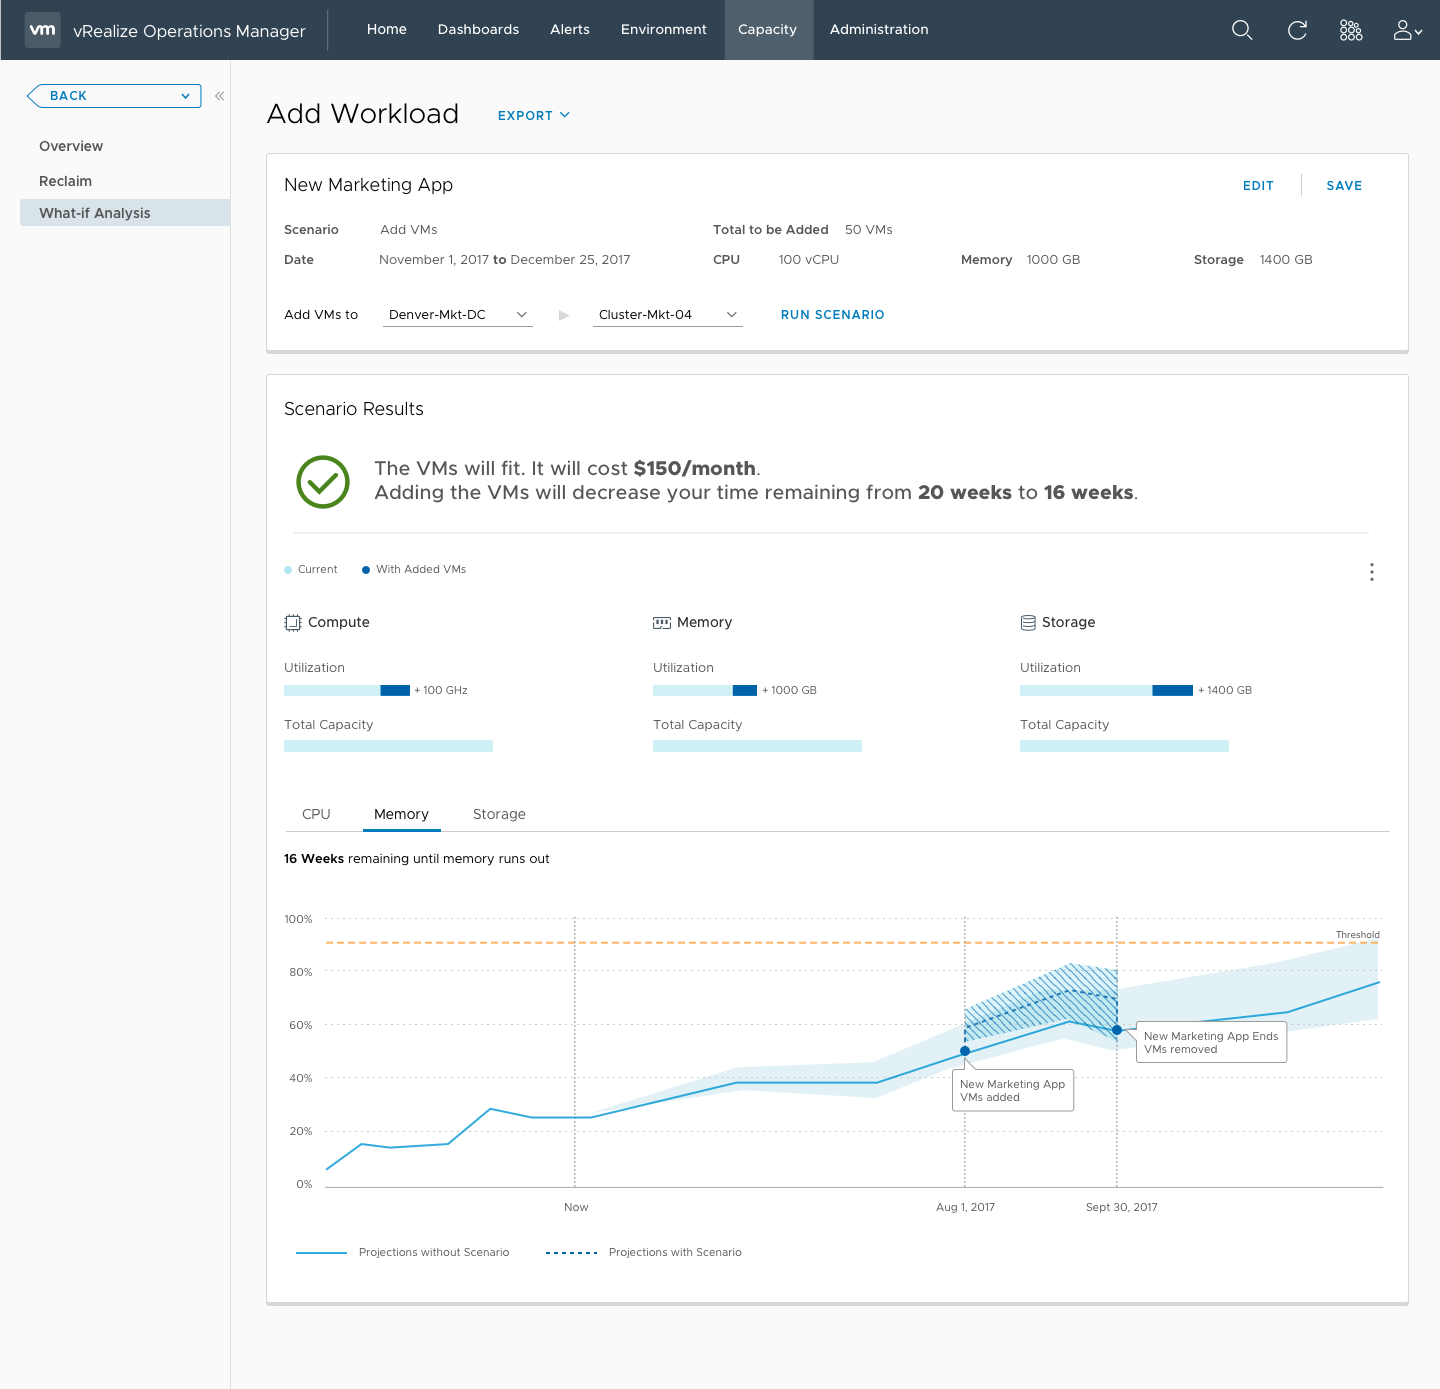
What if analysis (project planning)
We received user feedback that bar graphs indicating a single point in time wasn’t sufficient for users. They wanted to understand the historical usage pattern, the projections provided by our algorithm, and the impact of adding new projects to that. Since planning was too broad of a term, the flow was also renamed to ‘what if analysis’, where users can input various ‘what-if’ hypothetical situations to see how it will impact their environment. I created the mid-fidelity prototypes for this flow and designed the projection graph in the final design.
Validation and refinement
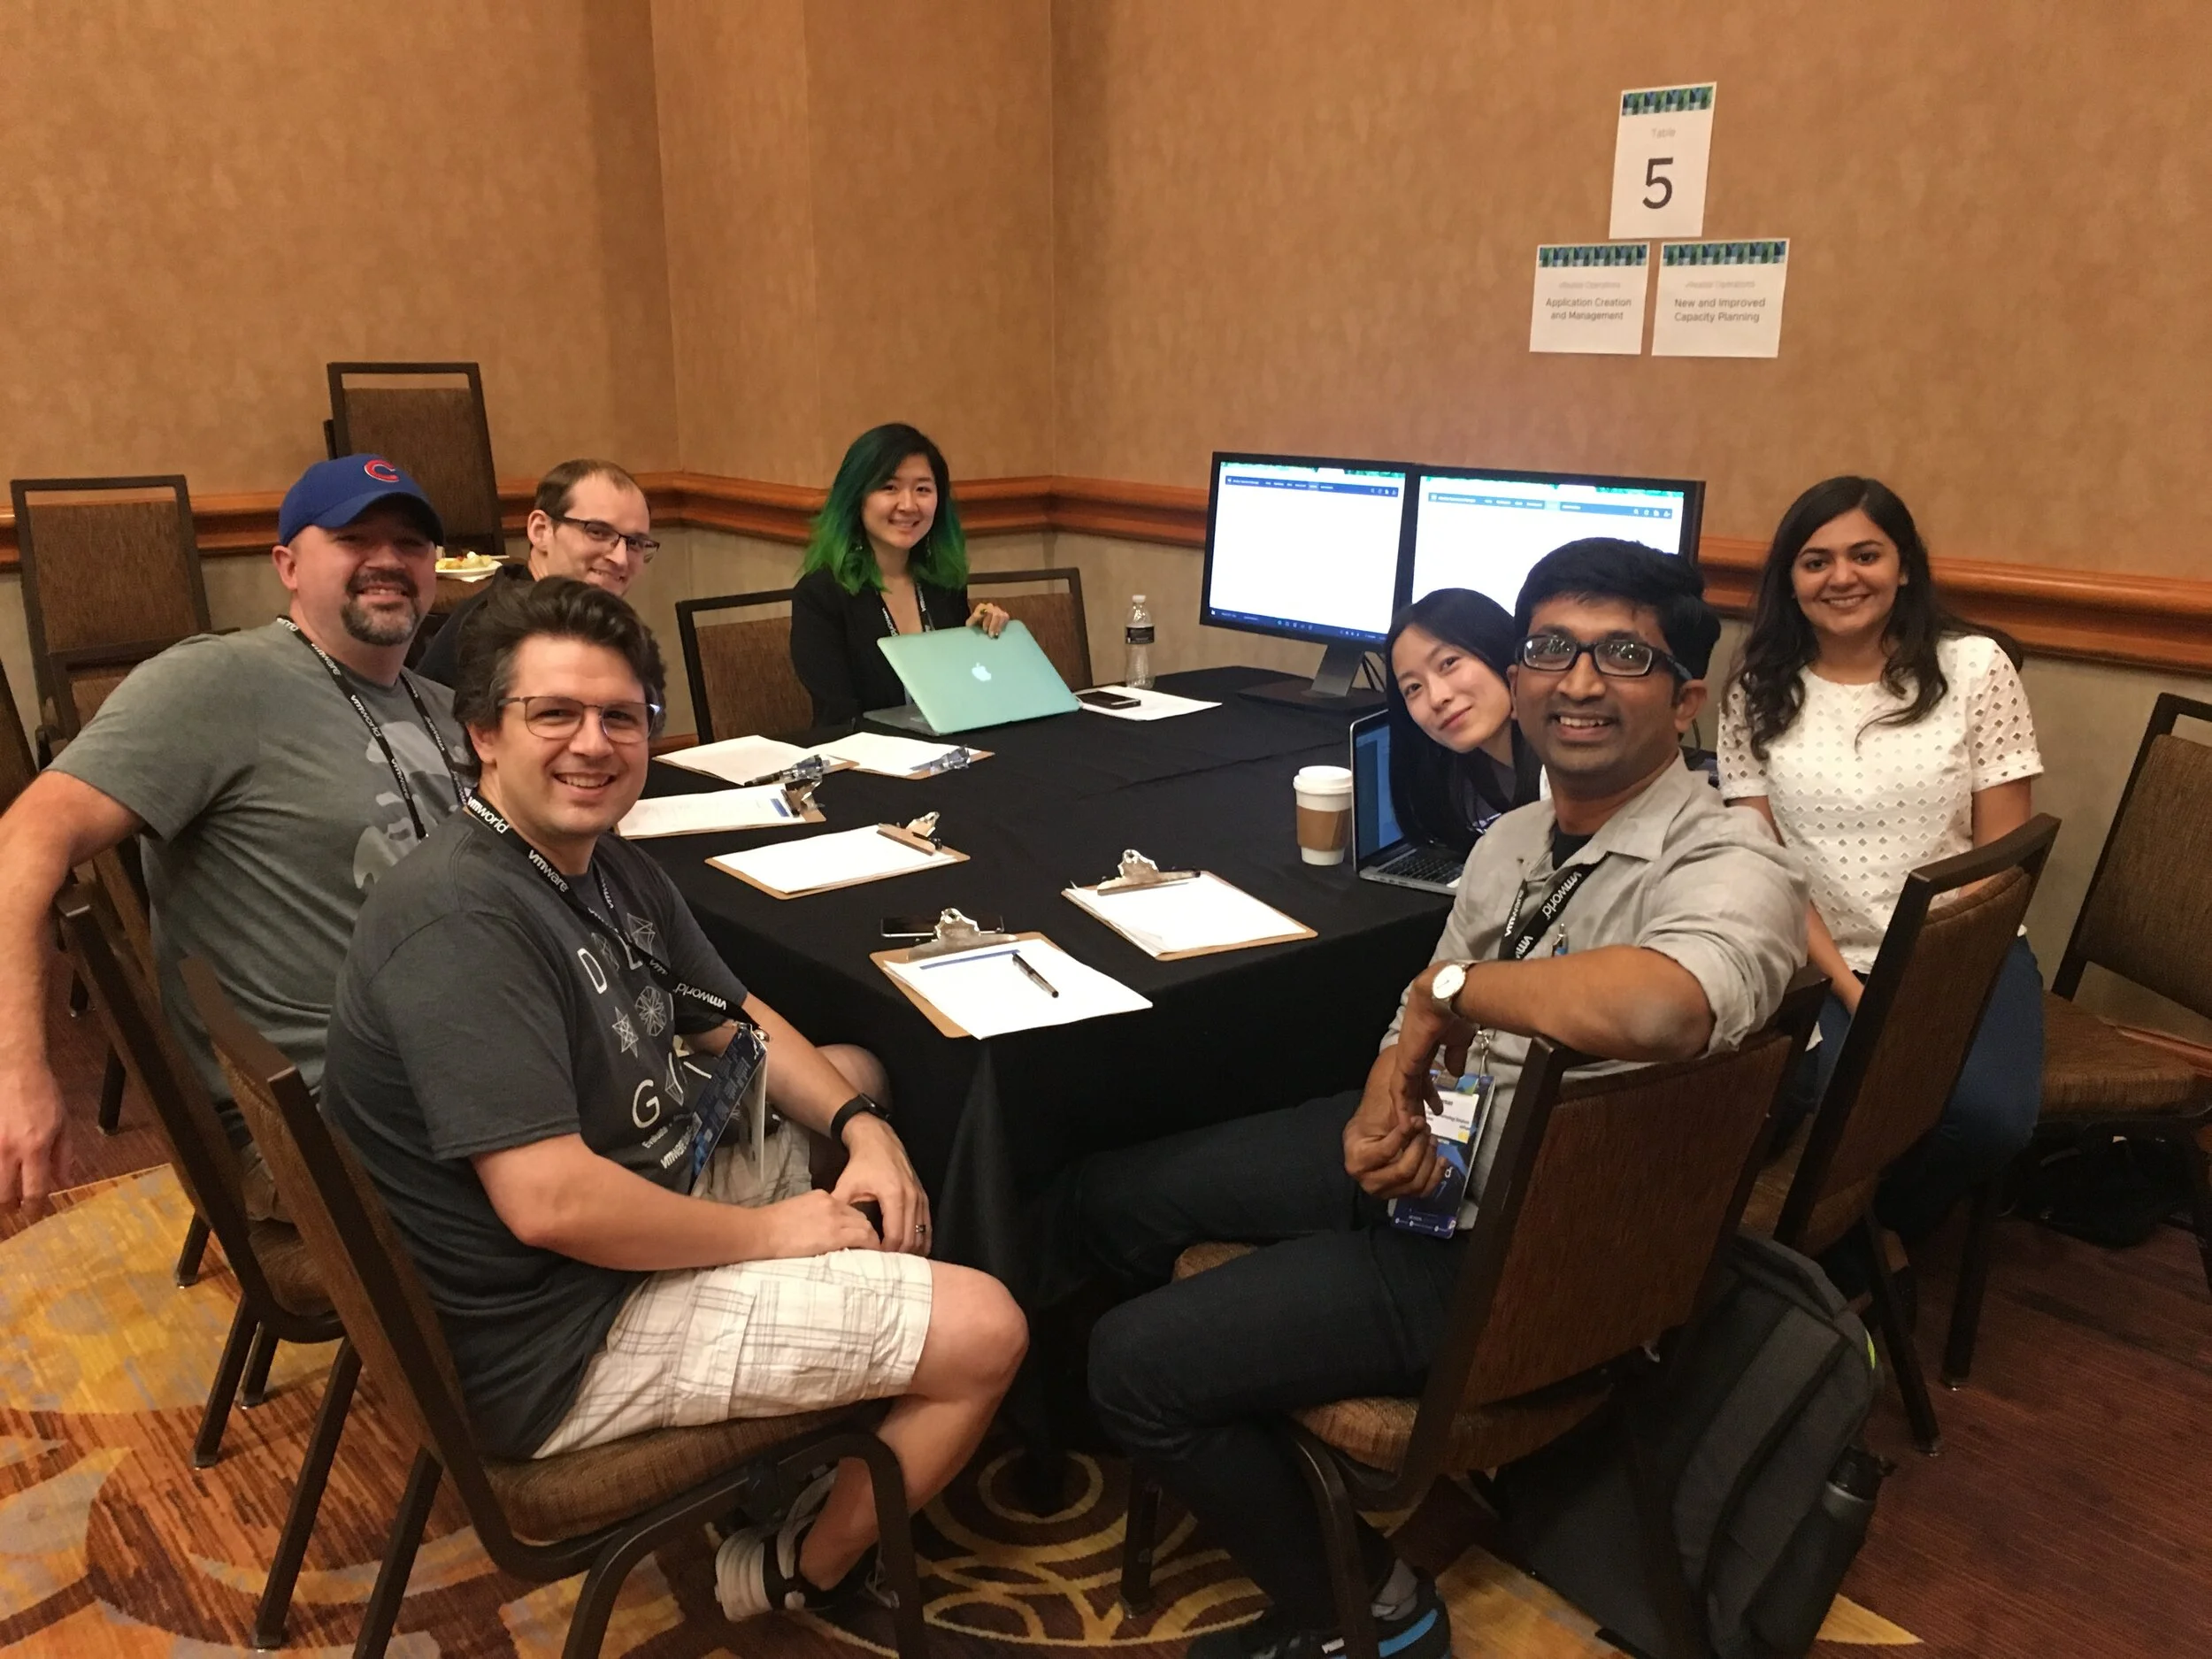
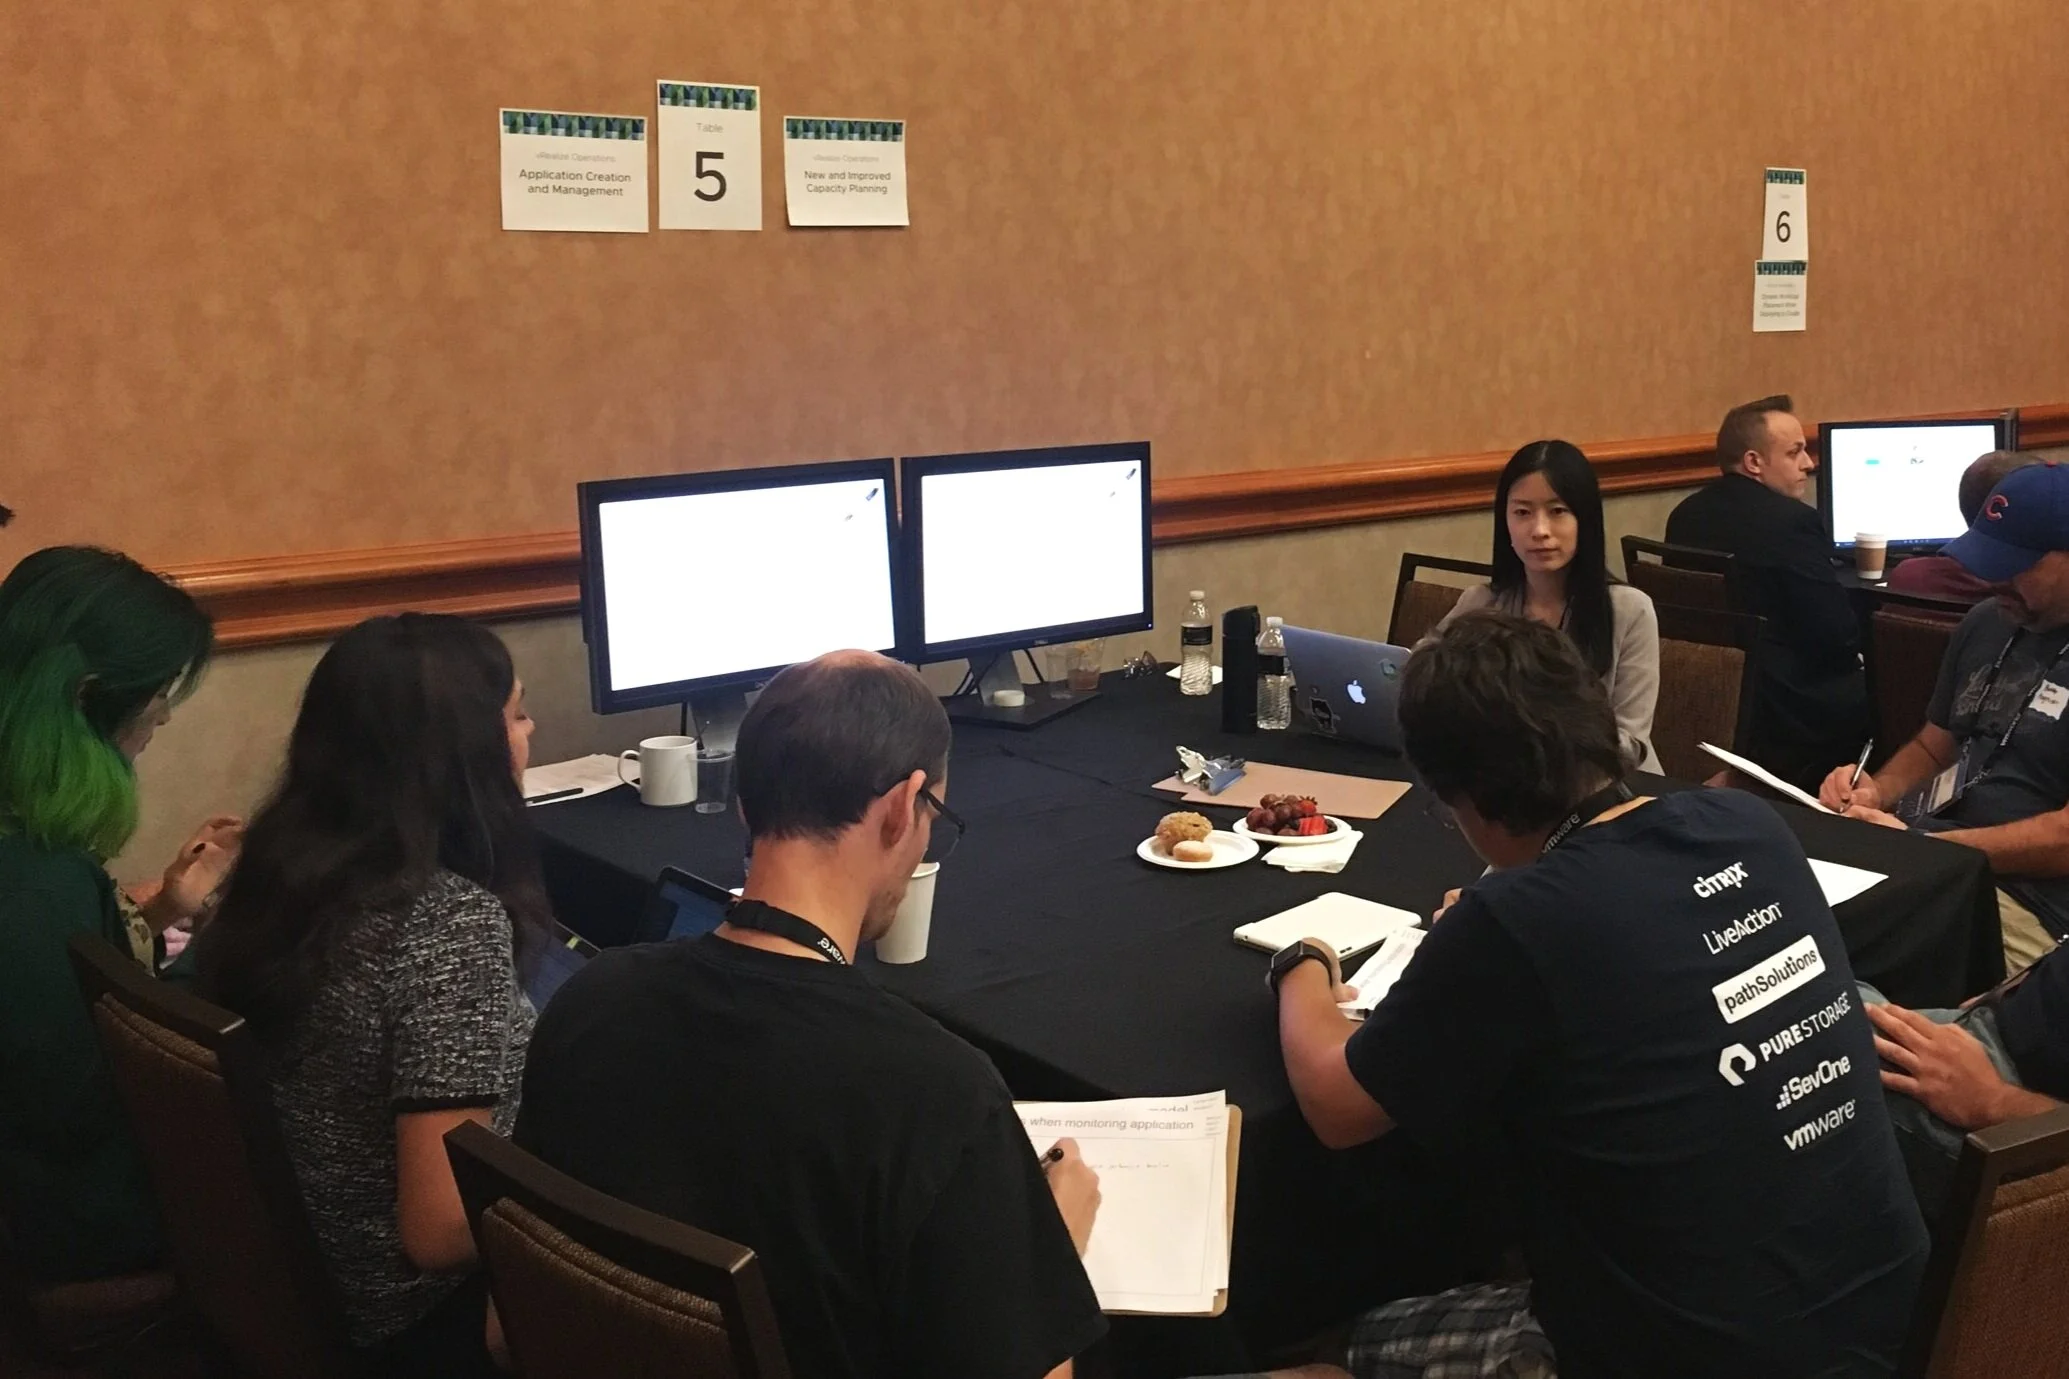
To validate our designs, we conducted a series of small group feedback sessions with our users at VMworld, VMware’s annual conference for virtualization and cloud computing. During these sessions, we were able to:
Validate scenario and design concepts
Identify customer challenges we missed before
Recognize opportunities for future improvements
We showcased the storyboards and designs to 28 different users and received valuable workflow, concept, and usability insights. We took this information and determined what we could refine and improve for this release and what will have to be for future releases.
Final Designs
The final designs were created using Sketch and Invision.
You can take a look at the storyboards and high-fidelity prototypes by clicking on the different workflows below:
Results
The project lasted 8 months, from conducting feature prioritization to getting the designs implemented into the product. We made final updates based on feedback from VMworld and worked with our engineering team to make the designs come to life. The capacity workflows were released as part of vRealize Operations Manager 6.7 in April of 2018. Since then, we’ve gotten more feedback from our users who are actively using the product, and we’re making additional improvements release after release.
“I no longer have to dig through a bunch of spreadsheets and tables. I can go to the Capacity Overview and see all the information in one place.” - vROps user
Constant user feedback throughout the process really made a difference in this project. It was very rewarding to see our initial design hypotheses transform into truly useful workflows that impact our users’ day to day.
Future work
There’s always room to improve workflows. As a follow-up to this project, one of the designers, the researcher, and I looked into what we can do to make this flow even better. We took a look at industry trends and user asks we weren’t able to address in this release.
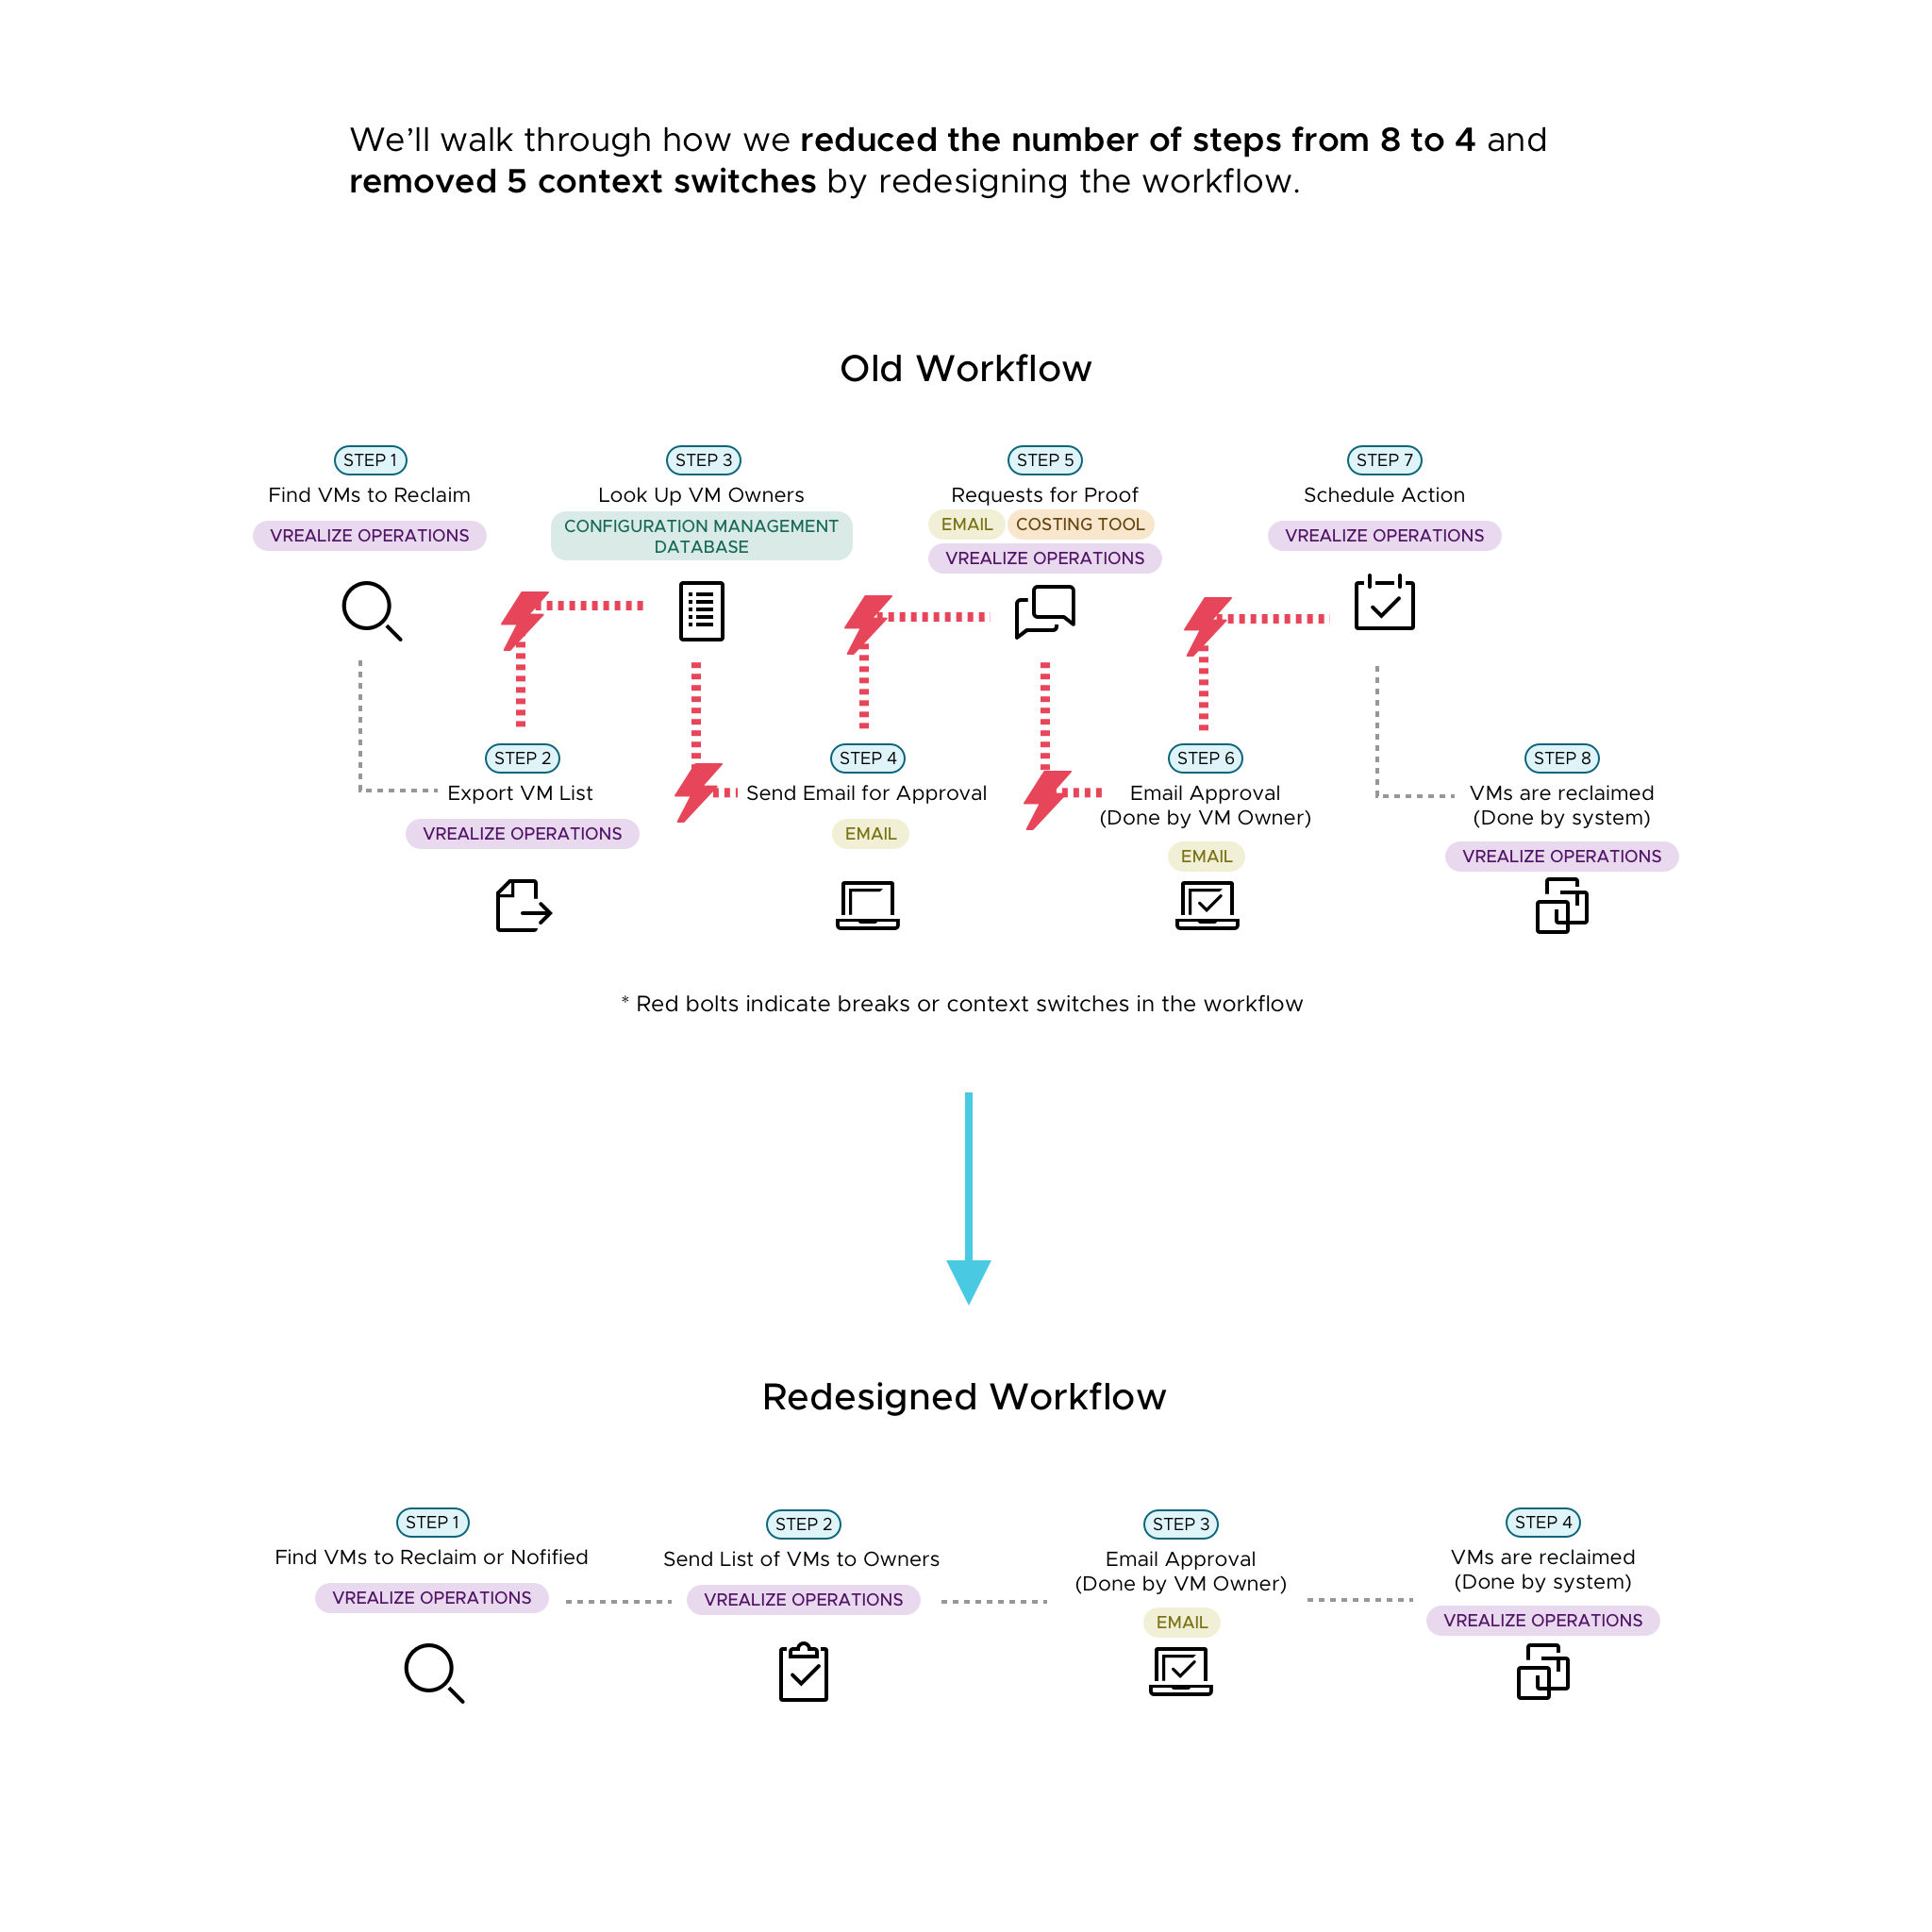
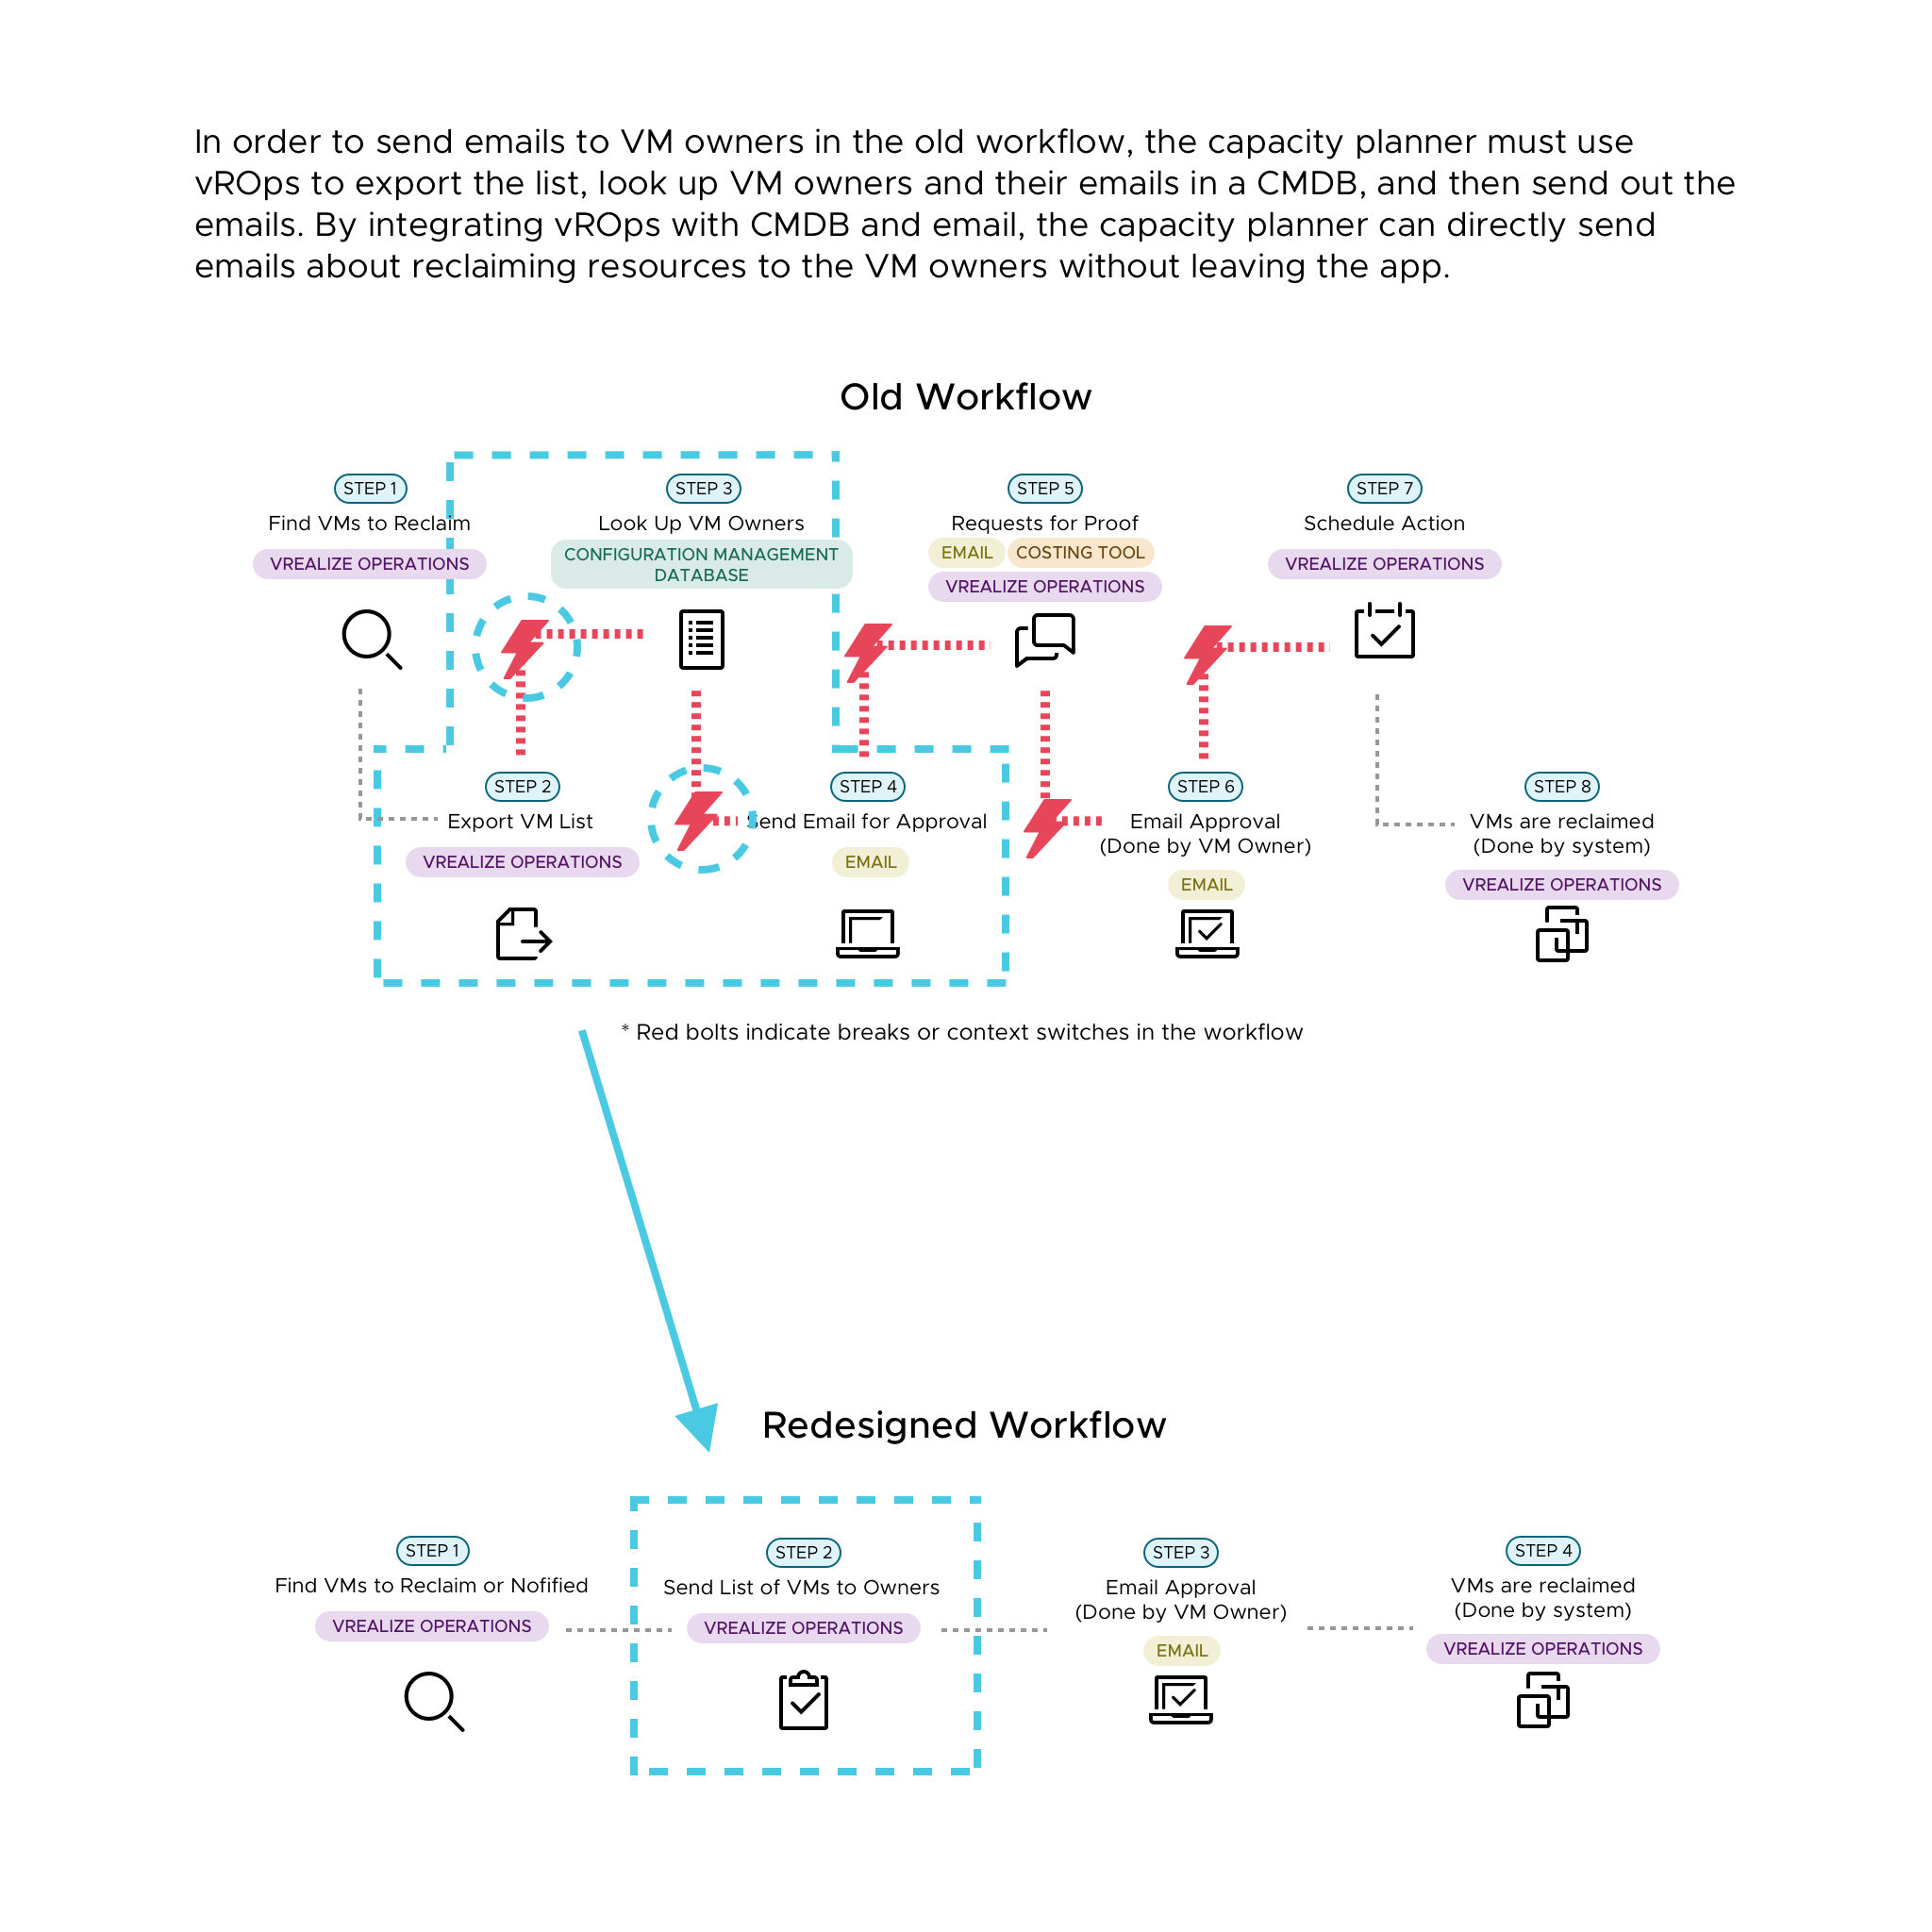
With that knowledge, we completed a research paper, design proposal, and prototype to allow for automated approvals and actions in the reclaiming resources flow. Below are the flows I created to visualize how we approached the problem:
The project was selected to be part of VMware’s Research and Development Innovation Offsite, where we presented the idea as a poster and a talk. The work was later used by our product team to influence future releases and roadmaps. The team is currently working on some exciting improvements for the coming releases!

